Search News Results
Insurers must adapt to ‘informal’ African market
Insurance companies are struggling to gain a foothold in Africa, where populations tend to favour community insurance schemes called tontines. These are often informal agreements between trusted friends and family members. EurActiv France reports.
Insurance is overwhelmingly an issue for rich countries. This does not seem likely to change, as 80% of the world’s insurance policies are held by the richest 10% of the population.
“Insurance is quite a new thing in Africa”, said Claude Fischer-Herzog, Director of Confrontations Europe.
“For Africans, insurance remains an elitist product”, said Hermann Kouassi, Executive Director of the Economic and Business Club of the Diaspora (CEADI). “And the fear of fraud is very strong, and often justified,” he added.
Less Elitist alternatives
But insurance, and particularly micro-insurance, has an important role to play in the economic progress of the developing world.
Micro-insurance, which is a form of protection against threats to the lives and livelihoods of low-income people in developing countries, represents a potentially vast market in Africa.
“In western and central Africa, 700,000 people hold micro-insurance policies that cost just €1 per year and guarantee their capital in the case of their death,” Frédéric Baccelli, Director General of Allianz Africa, explained.
“Insurance can secure a country’s economic growth against threats posed by the climate, for example,” said Jérémy Brault from Proparco, the branch of the French Development Agency specialising in private sector finance. “At Proparco, we have made insurance one of our target sectors.”
Tontines dominate the market
The insurance solution favoured by most communities in Africa is the “informal” tontine system. On the margins of traditional banking and insurance activities, tontines allow communities of individuals to save between friends, members of the same family or a community. “Tontines account for an important proportion of the African insurance market,” said Jérémy Brault.
Traditional insurance providers will have to adapt their products in order to seduce distrustful and often disadvantaged customers. “There is no question of applying the very individualised western models in Africa, where the prevailing model is one of intergenerational solidarity,” he explained.
But the rise of the middle classes in Africa could give the insurance sector a boost. “In Ivory Coast, for example, a more individualistic middle class is emerging, within which people will be more forward-looking”, Hermann Kouassi said.
Small share of the market
For now, the African insurance market is a relative lightweight, worth $72 billion in 2013. Frédéric Baccelli said “The insurance market in Africa is smaller than the turnover of Allianz in France”.
South Africa holds 80% of the continent’s insurance policies. The Maghreb countries account for 10% of the market, notably Morocco and Algeria, and the final 10% is spread across the rest of the continent.
Towards a single market?
Work has already begun on an African insurance single market. The Inter-African Conference of Insurance Markets (CIMA) is a group of 14 West African countries, including Cameroon, Central African Republic, Ivory Coast, Mali and Senegal.
Formed in 1992, this organisation unites the markets of its member countries by applying common codes of practice and a single supervisory authority. In 2013, the 163 companies in this embryonic single market had a combined turnover of $1.4 billion.
Frédéric Baccelli said “the annual growth of CIMA is around 7.8%. This is actually fairly low in relation to population and GDP growth in this region”.
The slow development of the insurance single market is partly down to CIMA’s restrictive regulations, according to Frédéric Baccelli: “For example, insurers have to reinvest 50% of their assets in countries of the CIMA zone, which limits their ability to make pan-African investments.”
Related News


The State of Commodity Dependence 2014
The aim of this report is to present an up-to-date overview of the commodity dependence in developing countries in a friendly and easy-to-understand manner.
In fact, commodities represent an essential source of export revenues for developing countries, but they also contribute for the main part of households’ and governments’ income in exporting countries. Moreover, commodities are also an important problematic in terms of social and political stability as well as of development in developing countries.
While the global notion of dependency is often well-known, its exact magnitude in developing countries and in the most vulnerable ones in particular, is not often well estimated. This is the purpose of the State of Commodity Dependence than to fill this information gap.
A developing country is considered as “Commodity Dependent Developing Country” (CDDC) when its commodity export revenues contribute for more than 60 per cent of its total good export earnings.
-
Two thirds of all developing countries are considered as CDDCs in 2012-2013 with 1 out of 2 located in Africa.
-
Commodity dependence increased in half of developing countries since 2009-2010
The State of Commodity Dependence 2014 report is divided in 13 sub-regional chapters; each chapter providing the same set of information:
-
A sub-regional introductory page presenting the performance of individual countries in the area for the main indicators under review in the report,
-
Individual country profiles for all countries in the sub-region. These country-specific tables aim to present – side by side – the latest available data with reference data for 30 different indicators.
Related News


European Parliament’s Trade Committee wastes ground-breaking opportunity on conflict minerals
Joint Civil Society Public Statement
Today [14 April 2015] the European Parliament’s Committee on International Trade (INTA) wasted a ground-breaking opportunity to tackle the deadly trade in conflict minerals. The Committee voted in favour of a weak and ineffective law that, if passed, would undermine global attempts to clean up the trade. It would require only a tiny number of companies importing four key minerals into Europe to source them responsibly and transparently.
INTA has failed to extend the legal requirements to the vast majority of companies involved in the trade, such as manufacturers, traders and companies importing products that contain these minerals. It also fails to regulate foreign actors that supply to European companies. Although we welcome a mandatory approach, this excessively narrow scope will likely fail to make a meaningful and lasting impact on a trade that fuels conflict and human rights abuses in countries like the Democratic Republic of Congo, Colombia, and Zimbabwe.
Civil society is calling on the European Parliament to strengthen the law when it votes in mid-May.
Despite millions of euro worth of tin, tungsten, tantalum and gold entering the EU every year from high-risk and conflict-affected areas, the EU has so far put no legislation in place to ensure these minerals are sourced responsibly.
Today’s vote in INTA follows a weak legislative proposal put forward by the European Commission in March last year. Under this proposal, responsible sourcing by importers of tin, tantalum, tungsten and gold would be entirely optional. The Commission’s proposed voluntary self-certification scheme would be open to approximately 300-400 companies – just 0.05% of companies using and trading these minerals in the EU, and would have virtually no impact on companies’ sourcing behaviour.
Investors, religious leaders, and civil society have all criticised the Commission’s approach, and have called on the EU to make sure that companies placing minerals on the EU market, whether in their raw form or as part of products, are legally required to source responsibly. Last month, the European Parliament’s Development Committee (DEVE) voted overwhelmingly in favour of such a mandatory regime. This year’s Sakharov Prize Laureate, Dr. Denis Mukwege, used his acceptance speech to urge the Parliament to do the same.
INTA has failed to respond to these calls for effective legislation and has instead favoured a largely voluntary scheme that further weakens the Commission’s proposal on a number of points. Under INTA’s scheme only a handful of European smelters and refiners that import tin, tantalum, tungsten and gold into the EU in their raw forms will be legally required to source those minerals responsibly. The regime will be entirely voluntary for other importers of these raw materials, and for companies that import or manufacture products containing them.
The law must be strengthened to make responsible sourcing a legal requirement for all companies that place these minerals on the European market – in any form. This would put the European Union at the forefront of global efforts to create more transparent, responsible and sustainable business practices. It would also better align Europe with existing international standards on responsible sourcing, and complement mandatory requirements in the US and in twelve African countries.
The Committee charged with tackling this issue has missed a critical opportunity. As a result, Parliament now risks taking a major step backwards in attempts to confront the trade in conflict minerals. We are calling on all Parliamentarians to listen to those who have spoken out on this pressing issue, and to vote for a regulation that compels all companies participating in the European market to source their minerals responsibly and transparently – a regulation of which Europe can be proud.
The INTA Committee has been designated to lead the European Parliament’s response to the conflict minerals proposal. It is expected that the Plenary of the European Parliament will vote on the conflict minerals regulation in mid-May. The result will define the Parliament’s mandate for negotiations with the Council of the European Union.
Related News


Now is the time! Use fiscal policy to support sustainable growth
In the global context of a moderate and uneven economic recovery, sound management of public finances can secure elusive growth and jobs.
In its latest Fiscal Monitor, the IMF recognizes influential factors that are assisting the recovery in many countries. Lower oil prices, growth-friendly monetary policy and slower rates of fiscal adjustment are all playing their part.
However fiscal risks remain elevated, the report warns. Advanced economies face the triple threat of low growth, low inflation and high debt. Emerging and developing economies have experienced softening growth and higher costs linked to financial and exchange rate fluctuations. Exporters of oil and commodities have been hit with lower revenues.
Smart taxation and spending and strong fiscal frameworks make a huge difference. “Fiscal policy continues to play an essential role in building confidence and supporting growth,” said Vitor Gaspar, Director of the IMF’s Fiscal Affairs Department.
The IMF Fiscal Monitor is published twice a year to track public finance developments around the world. The latest edition outlines three areas for action:
-
Strengthening fiscal frameworks
-
Reforming energy subsidies
-
Using fiscal policy to stabilize output
Advanced economies still slowed by debt
Public debt continues to present a headwind to growth. Despite significant efforts since 2010, advanced economies’ average ratio of debt to GDP remains above 100 percent. This is expected to decline only slowly in coming years and some countries’ debt projections have been revised upward.
Debt reduction efforts have been aided by stronger-than-expected growth in some countries, such as the United States. But they have been hampered by low levels of inflation levels in many advanced economies, notably in the euro zone.
Growth and inflation have the potential to significantly ease the debt burden. If Austria, Italy, Japan and Portugal could attain 4 percent nominal growth by 2017, their debt ratio could drop by as much as 10 percentage points by 2020.
Emerging markets and low-income countries
Average deficit for emerging, middle income and low-income countries is on the rise and expected to increase in 2015. Oil exporters have lost significant revenues due to the sharp drop in prices. While some have responded with fiscal tightening, others are accommodating the shock with increased deficits.
Volatility in financial markets, capital outflows, and exchange rates have raised the cost of financing for countries such as Brazil, Ecuador and Russia.
The recent Ebola outbreak added pressure to already fragile infrastructure in Guinea, Liberia and Sierra Leone. These countries were the first beneficiaries of the IMF’s newly established Catastrophe, Containment and Relief Trust. The trust will provide debt relief to countries public health crises of this kind and other disasters.
Areas for action
The Fiscal Monitor outlines three main recommendations. First, it advises strengthening fiscal frameworks so as to manage public finance risks and ensure debt is sustainable. Sound management can play a supporting role in delivering macroeconomic stability and growth.
Second, falling oil prices present an opportunity to reform energy subsidies and energy taxes. More than 20 countries have recently taken steps to cut energy subsidies, including Angola, Cote d’Ivoire, Egypt, India, Indonesia and Malaysia. Getting energy prices right would be beneficial to the economy, environment and public health. It would assist governments with their fiscal consolidation efforts or to make further investment in critical areas such as education and health. In advanced economies, taxes on labor could be cut, and paid for with higher energy taxes.
Third, the Fiscal Monitor’s analytical chapter explains why a stable macroeconomic environment is a growth-friendly one. Its analysis of 85 economies over three decades has a clear conclusion. Fiscal policy can stabilize output and gain about 0.3% extra growth annually. A blog by the IMF’s Xavier Debrun sums it up as governments needing to save in good times so they can stabilize output in bad times.
Related News


Surveys show continued economic progress in Liberia; a more uneven picture in Sierra Leone
Effects of Ebola on household welfare likely to reach well beyond the end of health crisis
The return to work continues in Liberia, led by gains for wage workers and the rural self-employed, while the picture remains mixed in Sierra Leone, where urban youth and the non-farm self-employed continued to lag behind. This is according to the latest round of high-frequency mobile-phone surveys conducted in both countries by the World Bank Group and partners, in order to assess how Ebola is impacting people’s livelihoods.
This comes as heads of state from Liberia, Sierra Leone, and Guinea prepare to meet in Washington, DC at the World Bank Group’s Spring Meetings to share their Ebola recovery plans with finance and development ministers and international partners. As Liberia approaches zero cases, and Sierra Leone sees promising declines in infection rates in recent weeks, it will be important to understand where economic recovery efforts should be targeted, and which people within each country need the most attention both now and once the health crisis has fully abated.
“Liberia has made remarkable progress in its fight against Ebola and I have great hope that all affected countries will get to and maintain zero cases,” said Makhtar Diop, World Bank Group Vice President for the Africa Region. “Even as these countries implement their respective economic recovery plans, the long-term economic and social impacts of such a prolonged and devastating outbreak will undoubtedly put many families and communities at risk. We and our partners must continue to respond quickly and effectively to support those who need it most.”
Statistics Sierra Leone has led the national data collection in that country, with support from the World Bank Group and Innovations for Poverty Action. In Liberia, the World Bank Group has worked closely with the Liberia Institute of Statistics and Geo-Information Services (LISGIS) and the Gallup Organization to conduct these mobile-phone surveys. Key findings are below.
In Liberia (read more)
-
The employment situation in Liberia continues to improve. A return in wage work and rural self-employment was offset by a typical seasonal lull in agricultural work, so the overall percentage out of work remains similar to January. Women continue to experience the worst job losses – they are typically self-employed, working as traders or in markets, the type of jobs that have been most impacted.
-
Most agricultural households report that their 2014 harvest was smaller than the previous year. These effects are not restricted to areas that have been directly impacted by Ebola, underlining the need to provide broad agricultural support across the country.
-
Food insecurity remains high, but has seen significant improvement in rural areas. Increases in urban areas have offset the decrease in rural areas, so the national level stayed about the same since January, with just under 75 percent of those surveyed reporting that they were concerned about having enough to eat in the previous week. The use of economic coping strategies such as selling or slaughtering livestock, borrowing money, and delaying investments has also leveled off, a hopeful sign that households are beginning to rebuild lost assets.
-
The use of public services appears to be rebounding. As schools have re-opened, more than three-quarters of respondents with primary school-aged children reported at least some have returned to school. Older children, however, saw a decline in attendance from last year. In both age groups, parents cited a lack of money as the main barrier to sending children back to school, rather than fear of infection. The cost constraints may be more significant for older children though as fees and costs are higher for later years of schooling, and because older children have more income generating potential for the household.
-
In health services, there appears to be a shift from private providers back to public providers, approaching pre-crisis levels.
In Sierra Leone (read more)
-
There are signs of improvement in Sierra Leone, but the economic situation remains uneven. While there have been overall improvements in employment since November – driven by urban areas, youth employment in Freetown has continuously declined and the percentage non-farm enterprises that are no longer operating has increased fourfold.
-
Stability of earnings has depended on the employment sector. Wage workers are earning around the same as they did pre-crisis, while those operating non-farm household enterprises are seeing revenues around 54 percent lower than in July-August 2014. Women in particular are affected, mostly due to the fact that they are generally working in non-farm household enterprises, the sector most heavily impacted by Ebola.
-
Food insecurity, which was high in Sierra Leone even before the crisis, continues to be a concern. Nearly 70 percent of households taking at least one action to cope with food shortages in the week leading up to the survey. Coverage of social assistance thus far reflects the disease-specific targeting of the emergency response, suggesting efforts to reach the poorest will be key as the country moves toward recovery.
-
Delivery of social services has generally improved. The utilization of maternal care services has increased significantly since November: the percentage of women who gave birth in a clinic up from 28 percent to 64 percent and the percentage who received at least one prenatal visit up from 56 percent to 71 percent. National educational radio programs, working to bridge gaps created by long-term school closings, have reached nearly 72 percent of households with school-aged children, who reported that at least some children listened to these programs.
“As the countries hardest hit by Ebola look toward economic recovery, data and evidence will be crucial to identifying and reaching those most marginalized by this crisis,” said Ana Revenga, Senior Director of the Poverty Global Practice at the World Bank Group.“We will continue to work with our partners to collect and share this information in a timely manner, in order to support their efforts today and down the road.”
A third round of mobile phone data collection in Sierra Leone is planned for April 2015, to continue to track and highlight the most pressing areas of attention for policy makers as they move toward the economic recovery phase.
In Liberia, this fifth round of data collection will be the last done by mobile phone. The World Bank Group is working with LISGIS to return to in-person surveys now that the infection risk is lower. These will allow for an even fuller understanding of what Ebola’s effects have been in that country.
Data collection at the household level complements broader efforts to understand the bigger picture, macro-economic impact of Ebola on the affected countries, as seen in a report to be released later this week.
Related News


Modest trade recovery to continue in 2015 and 2016 following three years of weak expansion
Growth in the volume of world merchandise trade will pick up only slightly over the next two years, rising from 2.8% in 2014 to 3.3% in 2015 and eventually to 4.0% in 2016, WTO economists announced on 14 April 2015.
Trade expansion will therefore remain well below the annual average of 5.1% posted since 1990.
The modest gains in 2014, marked the third consecutive year in which trade grew less than 3%. Trade growth averaged just 2.4% between 2012 and 2014, the slowest rate on record for a three year period when trade was expanding (i.e. excluding years like 1975 and 2009 when world trade actually declined).
Director-General Roberto Azevêdo said:
“Trade growth has been disappointing in recent years, due largely to prolonged sluggish growth in GDP following the financial crisis. Looking forward we expect trade to continue its slow recovery but with economic growth still fragile and continued geopolitical tensions, this trend could easily be undermined.
“But we are not powerless in the face of this gloomy picture. Trade can be a powerful policy tool to leverage economic growth and development. By withdrawing protectionist measures, improving market access, avoiding policies which distort competition and striving to agree reforms to global trade rules, governments can boost trade and seize the opportunities that it offers for everyone.”
In the short-term at least, trade expansion will no longer far outstrip overall economic growth as had been the general pattern for decades. The 2.8% rise in world trade in 2014 barely exceeded the increase in world GDP for the year, and forecasts for trade growth in 2015 and 2016 only surpass expected output growth by a small margin (Chart 1).
Chart 1: Growth in volume of world merchandise trade and real GDP, 2007-16P (Annual % change)
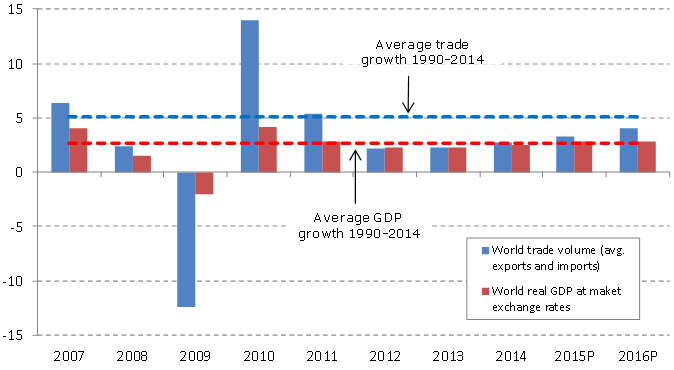
Figures for 2015 and 2016 are projections. Trade refers to the average of exports and imports.
Source: WTO Secretariat for trade and consensus estimates for real GDP at market exchange rates
Several factors contributed to the sluggishness of trade and output in 2014 and at the start of 2015, including slowing GDP growth in emerging economies, an uneven recovery in developed countries, and rising geopolitical tensions, among others. Strong exchange rate fluctuations, including a 14% appreciation of the US dollar against other currencies between July and March, have further complicated the trade situation and outlook.
Collapsing world oil prices in 2014 (down 47% between 15 July and 31 December) and weakness in other commodity classes hit export receipts and reduced import demand in exporting countries, but also boosted real incomes and imports in importing countries. Prices have continued to fall since then, suggesting excess supply, insufficient demand, or both. Whether this turns out to be a positive or a negative development on balance for world trade in 2015 remains to be seen.
The preliminary estimate of 2.8% for world trade growth in 2014 refers to the average of merchandise exports and imports in volume terms, i.e. adjusted to account for differences in inflation and exchange rates across countries. This figure is close to our most recent forecast of 3.1% from last September but below the 4.7% rise predicted at this time last year. A number of factors contributed to our initial overestimate, most of which could not have been anticipated.
The sharp declines in commodity prices since last July were not foreseen and did not figure in last year’s estimates. The oil price drop was driven by surging production in North America, but falling demand in emerging markets also played a part, as it did with other commodities.
One year ago, economic forecasters were predicting above trend GDP growth in the United States and near trend growth in the euro area in 2014. Both predictions promised to support stronger trade growth but neither materialized, as a mix of strong and weak quarterly results in the United States only produced average growth for the year, while activity in the euro area was consistently mediocre.
Geopolitical tensions and natural phenomena also weighed on trade growth last year. The crisis in the Ukraine persisted throughout the year, straining trade relations between Russia on the one hand and the United States and European Union on the other. Conflict in the Middle East also stoked regional instability, as did an outbreak of Ebola haemorrhagic fever in West Africa. Finally, declines in first quarter trade and output in the United States were attributed to unusually harsh winter weather.
The WTO’s trade forecasts depend on GDP projections from other organizations, but these have been consistently overstated since the financial crisis of 2008-09, biasing our trade forecasts upward.
Recent surveys of business sentiment and activity point to a firming of the economic recovery in the European Union, moderating growth in the United States, and subdued activity in some emerging economies, particularly Brazil and Russia. These indicators are consistent with the current trade forecast, but WTO economists cautioned that the presence of several risk factors added to the uncertainty of their estimates.
The most prominent risk is the divergence of monetary policies in the United States and the euro zone, as the Federal Reserve contemplates raising interest rates later this year while the European Central Bank has just started its own programme of quantitative easing. Others include a re-flaring of the debt crisis in the euro area, and a stronger-than-expected slowdown in emerging markets (particularly in resource exporting regions such as Africa, the Middle East, the Commonwealth of Independent States (CIS) and South America).
Finally, the rough two-to-one relationship that prevailed for many years between world trade growth and world GDP growth appears to have broken down, as illustrated by the fact that trade and output have grown at around the same rate for the last three years. This changing relationship has made trade forecasting particularly difficult in recent years and will continue to cloud the outlook for 2015 and 2016.
TRADE DEVELOPMENTS IN 2014
Annual data on merchandise and commercial services trade in current US dollar terms are presented in Appendix Tables 1 to 6. The dollar value of world merchandise trade stagnated in 2014, as exports rose just 0.7% to $18.95 trillion. This growth rate is lower than the one for merchandise trade in volume terms mentioned above (2.8% for the average of exports and imports), reflecting falling export and import prices from one year to the next, particularly for primary commodities.
By comparison, growth in the dollar value of world commercial services exports was stronger, increasing by 4% in 2014 to $4.85 trillion. It should be noted that the commercial services values are compiled using a new services classification in the balance of payments. Thus, figures are not directly comparable to those from earlier years. Comprehensive annual, quarterly and monthly data on merchandise and commercial services trade can be downloaded from the WTO’s website.
One striking feature of the merchandise trade values in 2014 is the weakness of trade flows in natural resource exporting regions. The dollar value of exports from South America, the CIS, Africa and the Middle East fell 6%, 5.9%, 7.6% and 3.9%, respectively, as lower commodity prices cut in to export revenues. A sharp drop in imports of South America (‑4.2%) reflected recessionary conditions in leading regional economies, while an even steeper decline in CIS imports (‑11.2%) stemmed from a combination of factors, including falling oil prices and regional conflict.
For broad country aggregates and regions that do not export natural resources predominantly, trade statistics in volume terms may provide a clearer picture of trade developments. The WTO and UNCTAD jointly produce a variety of short-term trade statistics, including seasonally-adjusted quarterly merchandise trade volume indices. These are shown in Chart 2 by level of development.
Chart 2: Volume of merchandise exports and imports by level of development, 2010Q1-2014Q4 (Seasonally adjusted volume indices, 2010Q1=100)
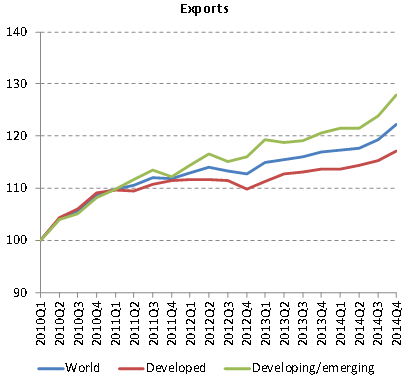
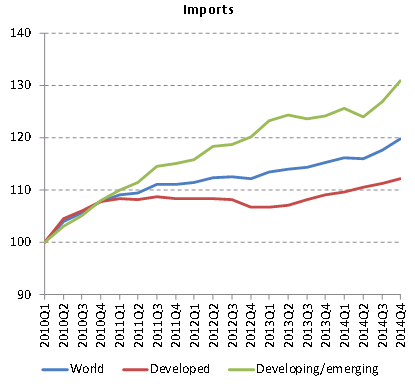
Source: WTO and UNCTAD Secretariats.
World exports in volume terms only increased by 1.9% in the first half of 2014 compared to the same period in 2013, but year-on-year growth in the second half rose to 3.7%. Exports of developed and developing/emerging economies were both slow in the first half (1.8% and 2.1%, respectively) but shipments from developing/emerging countries grew faster in the second half (2.5% for developed, 5.1% for developing).
OUTLOOK FOR TRADE IN 2015 and 2016
The WTO’s forecasts of 3.3% growth in the volume of world merchandise trade for 2015 and 4.0% growth for 2016 are premised on consensus estimates of world real GDP at market exchange rates from other agencies (Table 1). These figures imply multiples of trade growth over GDP growth slightly greater than 1 in 2015 and 2016, higher than the rough 1-to-1 ratios for 2012-14 but still well below the 2-to-1 ratios that were common not so long ago.
Exports of developing/emerging economies are forecast to grow 3.6% in 2015, while their imports are expected to increase by 3.7%. Meanwhile, a 3.2% rise is anticipated for developed economies on both the export and import sides.
Asia should have the strongest export performance of any region this year (5.0%), followed closely by North America (4.5%). Europe’s exports will also improve, with shipments rising 3.0% in 2015, up from 1.9% last year. The weakest export growth in 2015 will be in South America (0.2%) and Other regions (-0.6%, comprising Africa, Middle East and CIS), although small changes in export volumes from year to year are normal for resource-rich regions.
North America and Asia should both see imports increase by around 5% in 2015, while Europe records import growth of less than 3%. In contrast to this improvement, South America and Other regions are expected to record declines of 0.5% and 2.4%, respectively.
Table 1: Merchandise trade volume growth, 2011-2016 a (Annual % change)
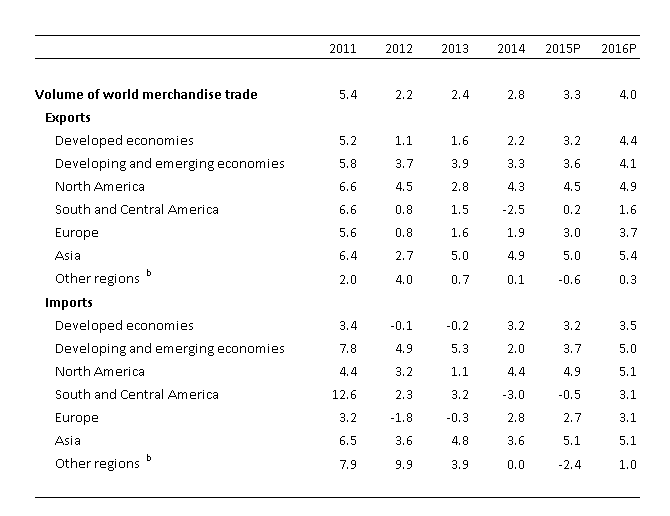
a Figures for 2015 and 2016 are projections.
b Other regions comprise the Africa, Commonwealth of Independent States and Middle East.
Source: WTO Secretariat.
Risks to the trade forecasts are mostly on the downside. One such risk is the unbalanced nature of the global economic recovery. After an unexpected drop in its output in the 1st quarter of 2014, the United States saw its GDP accelerate and its unemployment rate fall in the remainder of the year, which in turn lifted US imports. Continued strength in the US economy would buttress global demand and reinforce the trade recovery. Conversely, any shortfall in the US performance would leave few alternative sources of rising import demand. US GDP growth could disappoint if tighter monetary conditions and lower oil prices choke off investment, including in the energy sector.
Economic conditions in the European Union are improving, but EU-wide unemployment remains high (9.8% in February) and contentious bailout negotiations between Greece and the rest of the euro area threaten to revive financial instability.
The outlook for China is also less certain than before, as activity in the world’s largest economy (measured at purchasing power parity) has eased. The 7.4% increase in Chinese GDP in 2014 was the smallest such rise in 24 years, and Chinese officials have downgraded their output targets going forward. China’s growth is still likely to exceed that of other major economies this year and next, but it may do so by a smaller margin than in the past. This suggests steady rather than accelerating import demand in China.
Chart 7: Prices of primary commodities, January 2012 - February 2015 (Indices, January 2012 = 100)
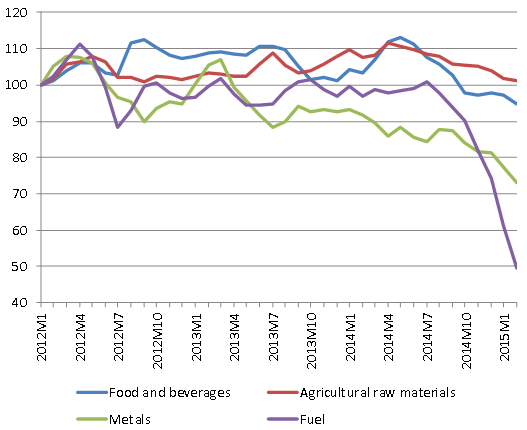
Source: IMF Primary Commodity Prices.
Lower prices for oil and other primary commodities provide some upside potential to the forecast if their positive impact on net importers of these products outweighs their negative impact on net exporters. The extent of the recent slide in commodity prices is illustrated by Chart 7. World trade could also grow faster than expected if a stronger economic recovery takes hold in the euro zone as a result of the European Central Bank’s recently announced programme of monetary easing. Any recovery in demand in the European Union would have a disproportionate impact on world trade statistics due to the fact that trade between EU members is counted in global totals.
Much attention has been paid to the fact that the rough two-to-one relationship that prevailed for many years between world trade growth and world GDP growth appears to have broken down, as illustrated by the fact that trade and output have grown at around the same rate for the last three years (Chart 1). A number of explanations have been offered for the slower rate of increase recently, including adverse macroeconomic conditions, the maturation of global supply chains, and the accumulation of post-crisis protectionist measures, among others.
No definitive explanation has emerged, but some stylized facts can at least be discerned. First, the ratio of world trade growth to world GDP growth (referred to as the “income elasticity of world trade” by economists) peaked sometime in the 1990s, long before the financial crisis, but has fallen since then (Chart 8). Second, it is normal for world trade to grow slowly for a time after a global economic shock before faster growth resumes (e.g. the oil crises of the 1970s and early 1980s). Finally, a smaller global trade elasticity does not imply a lower world trade/GDP ratio, which remains at or near record levels.
These facts suggest a combination of cyclical and structural factors at work behind the trade slowdown. So while the WTO foresees continued slow trade growth in 2015 and 2016, it does not rule out a return to faster trade growth at a later date.
Chart 8: Elasticity of world merchandise trade volume with respect to world GDP at market exchange rates, 1980-2014
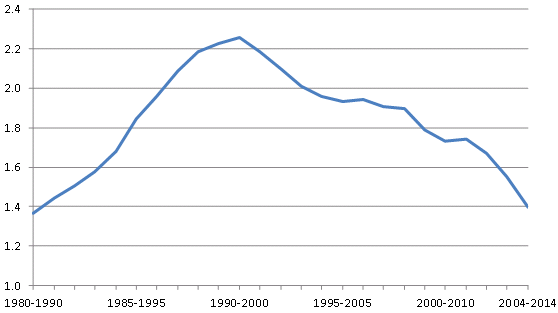
Note: Elasticities calculated by regressing log of world merchandise trade volume on log of world GDP at market exchange rates over 10 years.
Sources: WTO International Trade Statistics for trade, IMF World Economic Outlook database for GDP at market exchange rates.
Download the full Press Release below.
Related News


New Malawi Economic Monitor calls for restoration of macroeconomic stability
A new report by the World Bank analyzing Malawi’s economic development shows that the country’s economy continues to grow at a moderate pace and that GDP will not be overly affected by the floods that hit the country early this year. The economy is however characterized by macroeconomic instability and barriers to trade which Government needs to act on to improve growth prospects.
The maiden Malawi Economic Monitor report released in Lilongwe on 14 April 2015, is intended to provide an analysis of economic and structural development issues in Malawi, and will be published bi-annually. The first issue is titled “Managing Fiscal Pressures.” The report provides a macroeconomic outlook for Malawi, and in this first edition has a special topic on building trade competitiveness, addressing constraints that limit the country from benefiting from opportunities created by international trade.
The report indicates that Malawi’s GDP growth rate remained stable in 2014 estimated at 5.7 per cent, driven by expansion in agricultural, information and communications, and the wholesale and trade sectors. GDP growth rate is however projected to slow down to 5.1 per cent in 2015 mainly due to adverse weather which is likely to affect agricultural production, and subsequent manufacturing.
Downside risks to growth include a continued high rate of inflation averaging 23.8 per cent in 2014, high interest rates above 40 per cent, and a weak fiscal environment. Malawi’s budget position is under pressure with the country expected to run a deficit of 5.9 per cent of GDP during the 2014/15 fiscal year, compounded by the loss of budget support from donors. Further, public debt has risen sharply in recent years, with annual debt service costs now at a value equivalent to 5.3 per cent of GDP.
“With these significant challenges, Malawi needs to prioritize the restoration of macroeconomic stability through such actions as reducing the size of the budget deficit, scaling back domestic borrowing, and reforming key subsidy programs particularly the fertilizer input subsidy,” says Richard Record, Senior Country Economist for Malawi and lead author of the report. He adds that Government should continue implementing public financial management reforms to rebuild confidence in the integrity of Government accounts.
On the special focus on trade, the report observes that terms of trade have moved against Malawi over recent decades, with the unit value of exports falling compared to the unit value of imported goods. “This means the country has to trade an increasingly large volume of exports to pay for the same volume of imports. But Malawi has a real opportunity if she reduces her trade costs,” says Mombert Hoppe, Trade Economist for Malawi and contributing author.
To achieve this, the report recommends reforms for the country to build its competitiveness which include removing domestic policies that depress the performance of the export sector such as export bans; reviewing existing import and export licenses; and reducing barriers to competition in the transport sector to reduce transport prices.
Overall, the aim of the Economic Monitor report is to foster better informed policy analysis and debate regarding key challenges that Malawi needs to address in order to achieve high rates of stable, inclusive and sustainable economic growth.
Report recommendations to restore macroeconomic stability and build trade competitiveness include:
Steps to restore macroeconomic stability
-
Fiscal consolidation to reduce the size of the budget deficit
-
The application of a tight monetary policy and scaled back domestic borrowing to gradually reduce inflationary pressures
-
The reform of key subsidy programs, particularly FISP, in order to reduce fiscal pressures and to improve policy effectiveness
-
Implementation of public financial management reforms in prioritized areas to rebuild confidence in the integrity of Government accounts
Reforms to build trade competitiveness
-
Reviewing domestic policies that depress the performance of the export sector such as removing remaining export bans and ensuring that new ones are not introduced; reviewing existing import and export licenses; and streamlining the manner in which remaining licenses are applied
-
Reviewing and publishing trade regulations and their application and making them easily accessible in order to reduce costs, delays, and uncertainty
-
Consistent implementation of policy decisions to ensure a more predictable trading environment for existing firms and potential investors
-
Improving border crossing times and reducing delays and paperwork by implementing Government’s decision to reduce the number of agencies present at the border
-
Reducing barriers to competition in the transport sector in order to encourage entry and to reduce transport prices
Related News


The EPA, TISA and the LDC services waiver: How the regions are influencing Geneva
Mauritius’ intent to join TISA and the EU’s position on the LDC Services Waiver suggest a rare instance where regional negotiations – in this case, the Economic Partnership Agreements – are directly influencing discussions at the multilateral level. But bringing EPA ambitions into Geneva means bringing its lessons as well.
On the 5th February 2015, at a High-Level Meeting of the WTO Services Council, WTO Members outlined how they intended to support the growth of services trade for Least Developed Countries (LDCs), through operationalising the LDC Services Waiver agreed in 2011 at the 8th Ministerial Conference in Geneva. One month later, Mauritius announced its intention to join the plurilateral Trade in Services Agreement (TISA) negotiations.
These two events, while seemingly only tangentially related, mark a watershed moment for both Africa and the multilateral trading system. They reverse the normal dynamic whereby the WTO sets the framework for discussions at the regional and bilateral level: in this instance, regional negotiations appear to have directly shaped negotiating ambitions in Geneva.
The EPA as a testing ground
The key link is the ACP-EU Economic Partnership Agreement (EPA) negotiations. At the High-Level Meeting on the Service Waiver, the EU has essentially offered to the LDCs the same treatment as that granted to CARIFORUM under the CARIFORUM-EU EPA. In the TISA context, Mauritius is planning to table a services offer that had been originally formulated in its own EPA negotiations with the European Union (EU).
This suggests, for the first time, that the EPA negotiations – despite having been strongly criticised over their much-delayed timespan – are having a significant (albeit perhaps unintentional) impact on global trade discussions. Both the EU’s position at the High-Level Meeting and the Mauritius TISA announcement suggest that the EPA is turning into a testing ground for discussions in Geneva.
One hand, some developing countries are using the EPA to test how far they were willing extend market access to their developed partners. On the other, developed countries can explore their own willingness to extend special and differential treatment to their developing country partners.
These developments are occurring in a highly sensitive area (i.e. services) where many African ACP countries are negotiating for the first time with a developed economy, and in a context where donors and beneficiaries are negotiating a new type of “trade and development” agreement: one where trade policy is not exclusively shaped by commercial and mercantilist considerations, but rather as an explicit complement to – and arguably a subsumed extension of – development policy.
Mauritius and TISA – The role of the EPA
For Mauritius, its stated intention to join the TISA negotiations are a clear extension of a wider policy vision. A series of targeted reforms have guided Mauritius from a mono-crop/preference-dependent economy, to light manufacturing based on export processing zones, to a tourism hotspot, to plans for a global services hub. Mauritius’ plans to join TISA appear to be a natural means of attracting investment from the other TISA parties, in part as an entry-point into the wider pan-African market.
The very fact that Mauritius even has an EPA services offer to table is interesting in itself. Mauritius is negotiating as part of the Eastern and Southern African (ESA) regional configuration. The EPA negotiations between the EU and ESA have however been largely dormant for several years. While some progress has been achieved on a draft services text, little substantive exchanges had occurred with respect to offers and requests. In the meantime, Mauritius has been implementing its goods-only interim EPA.
Despite the impasse, Mauritius had already seized the opportunity of the EPA to prepare “back pocket” services offer. In the relative comfort zone of a North-South agreement where the EU was not likely to be the Mauritius’ primary target (given its continental ambitions), Mauritian negotiators could expand on their relatively thin GATS offer and build on their reform agenda for the domestic services market, all with a view to eventually bringing the offer (as a whole, or in pieces) to a wider setting. In essence, Mauritius used a regional opportunity to craft a multilateral offer.
The EU and the LDC Services Waiver: The promise (and perils) of the CARIFORUM EPA experience
For the European Union, there were clear rationales for extending the many negotiating “firsts” contained in the CARIFORUM-EU EPA services and investment chapter to the LDC Group in Geneva. There are also clear cautionary tales for the LDC Group in pursuing the opportunities therein.
In recognition of the fact that CARIFORUM’s small economies were unlikely to have significant Foreign Direct Investment (FDI) capacity into the EU, the EPA dispensed with the traditional FTA linkage between Modes 3 (commercial presence) and Mode 4 (temporary movement). The EPA instead expanded and deepened traditional categories of temporary movement outside of Mode 3 contexts, particularly those for contractual service suppliers and independent professionals. The CARIFORUM EPA focused on categories of service suppliers such as fashion models, entertainers and chefs de cuisine, where CARIFORUM’s small and developing service economies were likely to have a greater comparative advantage.
The architecture of the EPA services chapter drew from the particular hurdles facing CARIFORUM services suppliers: their small size, the complexity of (and high cost of meeting) necessary EU requirements and regulations, and the development potential of the services sector in the Caribbean. The CARIFORUM EPA implicitly recognised that overcoming these hurdles needed commercially meaningful preferences to spur ACP exports, rather than simple market opening or binding of the status quo. The approach was, in a sense, in the same spirit as the Lomé and Cotonou preferences in traditional commodities such as bananas, sugar, rice and rum.
As an extension of this “market access is not enough” approach, the EPA also explicitly linked the temporary movement provisions with critical enabling measures (e.g. encouraging regulatory bodies to negotiate the terms of mutual recognition agreements), as well a package of development cooperation funds aimed at the services sector.
Therein lies one probable rationale for the EU’s importing of the CARIFORUM EPA architecture to the LDC Services Waiver. Apart from the obvious fact that many LDCs are also ACP countries, many LDC service suppliers also share some of the structural barriers that the EPA sought to overcome. Many face a lack of knowledge of their own current and future export potential in services; a lack of understanding of market barriers in the EU (and where they were known, the existence of prohibitive barriers, such as the imposition of onerous taxes and fees); and severe supply-side constraints on small services firms.
Other, perhaps less altruistic, motivations may have prompted the EU to import its regional CARIFORUM commitments into the multilateral setting. Under political pressure to “operationalise” the Service Waiver as the LDC Group tabled its collective request, the European Commission had a ready-made package on offer – one which did not require significant additional analysis from the EU side, nor a new set of extensive and/or contentious negotiations with the EU Member States.
Yet the translation of the CARIFORUM EPA services package into the multilateral setting should also cause LDCs to pause and reflect carefully on the implementation of that very same package.
A recent EU-funded study reviewing the first five years (2008-2013) of the implementation of the CARIFORUM EPA found, inter alia, that there was little visible evidence of EU Member States’ actually having implemented the provisions on temporary movement. Some key EU markets (e.g. Germany) had yet to even ratify the EPA. Most efforts to craft mutual recognition agreements between relevant sector representatives had yet to materialise. Despite the Caribbean being a largely services-driven region, there was still a surprisingly small share of EU support dedicated to the services sector; many key projects had only recently (i.e. as of 2014) begun substantive operations.
Perhaps as a cause and consequence, the study team could not – after five years of implementation – identify a single Caribbean service supplier that had attempted to enter the EU services market using the EPA.
The CARIFORUM-EU struggle to operationalise its preferential services scheme over the (thus far) nearly seven-year life of the EPA should send clear signals to both LDCs and their potential preference-granting partners. It points to the significant practical and political difficulties in creating tangible, commercial valuable and development-oriented preferences in the services sector for small and developing economies. These difficulties in turn suggest the degree of realism over what can be achieved over the 15-year lifespan of the LDC Services Waiver.
Conclusions: The tail wagging the dog?
In a lecture in Riga in March 2015, the Director-General of the WTO seemed to downplay the importance of regional trade agreements, by stressing that “there are many big issues which can only be tackled in an efficient manner in the multilateral context through the WTO,” where the challenges facing global trade were “global problems demanding global solutions”. This article suggests however that some global problems require (or can at least draw from) regional solutions.
In regional trade agreements, WTO Members may feel more comfortable in testing difficult and unchartered waters between a smaller and better-known set of negotiating partners. Sometimes, non-trade linkages and processes (e.g. aid relationships between donor and beneficiary) can provide a comforting counterpoint to the sometimes-fraught dynamics between trade negotiating partners. This comfort zone is arguably most important for the WTO’s smallest and least-developed Members who form a majority of WTO Members, and have often argued that their small and underdeveloped markets are ill-prepared and unsuited to reap the traditional gains from multilateral trade liberalisation
Yet these lessons and impacts of these regional experiments must be, in the end, clearly understood before being brought into discussions in Geneva. After all, if a services package has yet to fully deliver in a regional setting between a smaller set of countries, what measures are in place to guarantee its success in the much larger multilateral setting?
Sacha Silva is a Senior Economist, WTI Advisors, Geneva. The author wishes to thank, without implication, Isabelle Ramdoo, Ramesh Chaitoo, Hadil Hijazi and Hannes Schloemann for their comments.
This article is published under Bridges Africa, Volume 4 - Number 3 by the International Centre for Trade and Sustainable Development.
Related News


SA trade sectors show interest in AGOA
South Africa and the United States have agreed to continue to work together to address concerns around the African Growth and Opportunity Act (AGOA) which is designed to help qualified sub-Saharan African countries economically. Sectors in South Africa that have shown interest in AGOA are the wine, citrus, auto, and textiles industry.
AGOA is a legislation that provides duty-free market access to the US for qualifying sub-Saharan African countries by extending preferences on more than 4,600 products.
It has created 100,000 jobs in the US and 350,000 direct jobs and 1.3 million indirect jobs in sub-Saharan Africa. In South Africa, AGOA is estimated to have created 62,000 jobs. The current AGOA is set to expire on 30 September 2015.
It is for this reason that the South African delegation is in the US for the Trade and Investment Framework Agreement (TIFA) talks with the US Trade Representative to advocate the renewal of AGOA.
Main concerns relate to – among others – market access in South Africa for certain US products.
This agreement follows a conversation between Deputy President Cyril Ramaphosa and US Vice President Joe Biden who discussed the critical role that AGOA has played in expanding US and Africa trade.
Biden urged South Africa to address these issues as soon as possible. He reiterated Washington’s interest in renewing AGOA as soon as possible, for as long as possible, in order to continue to encourage sustainable investment and robust economic growth in sub-Saharan Africa.
Last week, Rob Davies, Minister of Trade and Industry in South Africa, said, “South Africa together with sub-Saharan Africa have been calling for 15 year renewal of AGOA for all eligible countries without any conditionalities. This position was also reiterated by the African leaders at the US-Africa Leaders Summit in Washington last year. Even congress members believe that AGOA should be extended; it is the only programme that enjoys bipartisan support.”
“For us as the African continent we believe the programme should be extended for 15 year renewal for the following reasons:
-
AGOA has been successful and it contributed in transforming Africa from a continent that used to rely on development aid to a continent that is today referred as “rising.”
-
The programme contributed to revival of industrialisation in the continent following periods of deindustrialisation. Due to AGOA, sub Saharan Africa countries managed to attract new investments in clothing and textile, and other industries.
-
It contributed to regional integration and creation of regional value chains as AGOA allows cummulation amongst the countries. Examples here include leather car seats, where South Africa source leather from Botswana and denim clothes, South African textile and clothing industry procures part of its raw materials from other regional garment producers – mainly Lesotho, Swaziland, and to some extent Mauritius. Further, South Africa exports some trims (zips, buttons, sewing thread, wadding, tapes and elastics) to Lesotho for its clothing industry.
-
AGOA generated enormous good will for the US in the continent.
-
The benefits of AGOA are two-way, estimate indicate AGOA created 100 000 jobs in the USA and 350,000 direct jobs and 1.3 million indirect in sub Saharan Africa. In SA, AGOA is estimated to have created 62 000 jobs
-
5 years is a significant period for African countries to attract much needed investment and for those investments to realise returns.
-
Further, the continent needs 15 year renewal of AGOA as most Least Developed Countries (LDCs) in Africa would graduate to developing country status around 2030. Why South Africa should be included in AGOA
-
AGOA is important to balance the structure of trade. SA exports still concentrated around raw materials. 43% of SA exports to US are metals and mineral products. On the other hand, South Africa imports largely value-added products from the US.
-
AGOA contributed to the development of automotive industry in South Africa. There is a growing intra-industry trade in the automotive sector between SA and the USA.
-
The view that SA is more developed with diverse portfolio of products is misleading as the country still experiences the triple challenges of poverty, unemployment and inequality. The country currently has 56.8% of its population below the poverty line, and 24.3% of population that remains unemployed.
-
SA is part of a customs union with a common external tariff; any attempt to exclude SA from AGOA will undermine SACU.
-
SA remains an important anchor for regional value chains (RVC) in the continent; any attempt to exclude South Africa will undermine regional integration and RVC.
-
Removing South Africa from AGOA will reduce the value of AGOA for other African countries, as they depend on South Africa for key inputs. AGOA will thus become less effective and lose its significance. It is also for this reason that the African Ambassadors in Washington, and the Commissioner for Trade of the African Union (AU), made representations to the US Congress underlining this point. The AU is in full support of South Africa’s continued inclusion in AGOA.”
Related News


Contributions of the non-farm enterprises in poverty reduction in Ethiopia
The economic progress Ethiopia has been scoring since the introduction of the Agricultural-led Industrialization Economy has taken the attention of the international media and organizations. In this regard, the World Bank analyzed the progress in order to identify the factors that contribute to the progress and poverty reduction. “The Progress driven by agricultural growth, investments in basic services and effective safety nets. The pace of poverty reduction in Ethiopia has been impressive, especially when compared with other African countries,” it states. In addition to this, the bank also analyzed the contributions of the non-farm enterprises that this article deals with.
In addition to being the primary sector of activity for 11-14 per cent of the population, a further 11 per cent of rural households earn about a quarter of their income from operating non-farm enterprises (NFEs) in the service sector. This income is earned largely during harvest months and months immediately following harvest. The income earned from these activities improves the Well being of households and its role in reducing poverty is considered to be significant.
Ascertaining the impact of these types of service sector activities on poverty reduction is Considerable and it is possible to provide more information on the amount of income these activities generate and for which types of households. These individuals often have a primary categorization in agriculture and the non-farm income they earn is highly correlated with agricultural income, causing growth analyses to attribute this impact to agricultural growth. Simply ascertaining whether households with NFEs are poorer or richer than other households also does not address this question. If households with NFEs are richer it could be that operating NFEs is a means by which some poor, uneducated households grow their incomes and escape poverty. On the other hand, it could simply be the case that these households are already better off and are able to invest in high-return NFE activities, and are thus more likely to operate them.
Additionally NFEs in Ethiopia are largely complementary to agriculture and driven by growth in this sector. The close dependence of NFE activity on agricultural income means that this is not a driver of poverty reduction on its own. An initial assessment of constraints to NFEs suggests that interventions to increase demand will have the largest impact on increasing the vibrancy of this sector and its role in reducing poverty. On the supply side, NFEs appear to depend on agricultural income for inputs and investment capital. On the demand side, they rely heavily on increased local demand during the harvest period to generate household income. The need for capital does not appear to be a major cause for the current seasonality of NFEs, but many do report access to market demand as a major constraint. Increasing demand will require further investments in infrastructure, increased employment the manufacturing sector on non-seasonal service sector activities, and increased agricultural revenues.
The analysis uses detailed data on the livelihoods of households in rural and small-town. Ethiopian Rural Socioeconomic Survey (ERSS) sample is representative of rural Ethiopia and towns less than 10,000 people. The data includes both those counting the service sector as a primary occupation the service sector in rural Ethiopia and small towns comprises 67 per cent self-employed activities. NFE ownership is defined as the operation of a non-farm enterprise involved in the provision of non-agricultural services such as carpentry, the processing and sale of agricultural by-products such as flour, trade, professional services, transportation services, and food services. A household was considered to operate a NFE in the survey if it reported to have operated one or more of these types of enterprises in the twelve months prior to the survey, including those ventures that had been shut down permanently or temporarily during that time.
In Ethiopia, NFE activity is primarily concentrated in processing and sale of agricultural products, trade of other products or offering a service from home or a shop. The most prevalent NFE type is the processing and sale of agricultural byproducts, which is strongly tied to agricultural activities. Twenty-eight per cent of NFE operating households operate this type. A further 28.3 per cent of NFE-owning households offer a service from home or a household-owned shop and 24.2 per cent trade in a market or on a street. Stark differences in the prevalence of non-agricultural NFEs that are operated from home or a shop exist between rural areas and small towns with over 40 per cent of households in small town areas reporting to operate a NFE of this kind.
One in five households in rural Ethiopia own an NFE. NFEs dominated economic activities in small towns with 55 per cent of small town households operating at least one NFE. On the basis of the ERSS, it can be estimated that there exist approximately 2.9 million NFEs in Ethiopia with 20.2 per cent of all households in rural and small town areas owning at least one NFE. NFEs are found to be mostly young with a mean age of approximately six years and a median age of two years. The difference in median and mean arises because of the high number of very young enterprises and the presence of a few older NFEs. A third of all NFEs were started in the year leading up to the survey. In the absence of clear evidence of high growth in the proportion of households operating an NFE, this suggests significant churn in the operation of NFEs.
There is some indication that it is the less educated households in small towns that operate NFEs, as opposed to more educated households in rural areas. In rural areas, NFE household heads have an average of 0.5 more years of education than households without a NFE suggesting that better educated households may be better equipped to choose to engage in NFE activities. Conversely, in small towns they have on average 3.3 fewer years of education than households without a NFE, pointing to higher education potentially providing better access to public sector and wage jobs. Households in small towns do have higher access to wage jobs with over 15 per cent of those seven years and older working in wage jobs, compared to less than 3 per cent of those in rural areas; most of the wage jobs are with the government or private enterprises. NFE participation is more prevalent among households with lower landholdings per head, which may indicate some households are pushed by necessity into NFE operation. In small towns, where households generally have very little land, those that do not operate a NFE own on average more than double the land assets of NFE-owners.
This gap narrows but becomes statistically significant for households in rural areas. In addition house holds that operate an NFE are less likely to own livestock, suggesting these are alternate sources of livelihood for households. Households without a NFE own more livestock than NFE households in both sub populations with a comparably sized gap.
There is no significant difference in the rates of NFE ownership between male and female-headed households in rural areas, nor in small towns once other characteristics of households such as education and consumption per capita have been taken into account. In small towns female-headed house- holds represent a greater proportion of households with NFEs at 38.3 per cent than without NFEs at 29.3 per cent.
One out of every six households (16 per cent) in the bottom 40 per cent operate an NFE, but rates of NFE ownership are higher among non-poor households: one out of every four households (24 per cent) in the top 40 per cent own an NFE. Prevalence is higher among higher quintiles with 26.3 per cent and 21.3 per cent of households in the fourth and fifth quintiles, respectively, operating a NFE.
Analysis using panel data also finds that higher consumption growth is positively correlated with a higher initial share of non-farm enterprise income. Households with NFEs in rural areas consume an average of 280 Birr more per annual adult equivalent than those without NFEs, which rely primarily on agriculture. The difference in consumption is significant when household size and education and age of the household head have been controlled for. It could be that operating NFEs is a means by which some poor, uneducated households grow their incomes and escape poverty. On the other hand, it could simply be the case that it is those households already better off, that are able to invest in high-return NFE activities, and are thus more likely to operate them.
There is no difference in the consumption level of households with and without an NFE in small towns. In small towns, households that operate NFEs, on average, consume approximately 250 Birr less per annual adult equivalent than households that do not. However, these differences are not significantly different.
Over half (54 per cent) of NFE operating households report that NFEs generate approximately a quarter of their income: these are households for whom service sector activities contribute significantly to household welfare but who do not report their primary sector of occupation as services. Households in small towns, however, report more often to be generating a share of around half or three quarters of total household income through the operation of a non-farm business, and 21.9 per cent indicate that it generates the household’s entire income. Calculating average annual incomes per NFE, we find a median annual NFE income of 700 Birr. Median annual NFE income in small towns is 1600 Birr, relative to a much lower value of 650 Birr in rural areas, indicating that most small town NFEs are generating more income than their rural counterparts.
However there are some NFEs that earn much higher levels of income and this is indicated in the fact that the mean income in rural areas is much higher than the mean income in small towns. Using the source of consumption data in the 2011 Household Consumption Expenditure survey suggests that nationally, 10 per cent of consumption is funded through non-agricultural household enterprises.
Households for whom NFE activities comprise more than half of their income will report this as a primary sector of occupation in national surveys. NFEs generate, on average, one sixth of the returns generated by a hectare of land used for agricultural production. The median NFE increases household income by 20 per cent and generates the income equal to about 0.16 to 0.18 hectares of land. In a number of settings NFE income allows households to become more resilient in the face of agricultural shock such as weather.
The association between NFE start-ups and the main agricultural period suggests that business activity was taken up in anticipation of or in response to highly active agricultural activities and heightened local demand. In rural areas, most NFEs list the top three months of activity as November, December and January and in small towns NFEs list December, January, and February as the most important months for activity. There thus appears to be a small, one month lag in peak NFE activity between small town and rural sub-populations. This lag may indicate a rural supply-chain trend.
On the supply-side, most households rely on agricultural income to fund the creation of NFEs. Overall, agricultural income is reported to be either the primary or secondary source of start-up capital for 64 per cent of NFEs. NFE households report the next important source of start-up capital to be non-farm self-employment income, noted as a primary or secondary source of funds by 18 per cent of households. This result can be explained by the fact that some households operate multiple NFEs and may thus use the income from one NFE to start another.
Rural NFEs tend to rely more heavily on agricultural income for start-up capital than small town NFEs, with 65.7 per cent of rural households citing agricultural income as a main source of funds for NFEs, as opposed to only 13.7 per cent of small town households. This result can be explained by the greater prevalence of non-farm activities in towns, and the stronger direct links with agriculture in rural areas.
Although there is a statistically significant difference in the proportion of households reporting September, October, and November as a high month for NFE activity, there is no significant difference in the overall trend throughout the year for farming and non-farming households. Despite the fact that non-farm households cannot rely on agricultural income to fund the operation of their NFEs, they still exhibit increased NFE activity from November to February. The customer base of most NFEs appears to primarily comprise the local market, local consumers or passers-by, and traders, indicative of the local nature of the markets they serve. Locals and passers-by constitute a somewhat higher share of the customer base in small towns than in rural areas, with 41.6 per cent and 29.5 per cent of NFEs reporting this as one of their two main customer bases, respectively. Additionally, selling to traders appears to be more common for rural NFEs, as 16.8 per cent of rural households reported traders as a main customer base, relative to 10.4 per cent of small town NFEs. Generally, NFEs appear to depend on agricultural income for inputs and investment capital. On the demand side, they rely heavily on increased local demand during the harvest period to generate household income. The need for capital does not appear to be a major cause for the current seasonality of NFEs, but many do report access to market demand as a major constraint.
Related News

Russia proposes BRICS parliamentary group
Russia’s proposal to create an inter-parliamentary group in a joint effort to protect the economic and political interests, influence politics at the global arena and as an important strategic tool for promoting development among BRICS (Brazil, Russia, India, China and South Africa) member states has sparked discussions while others are watching bloc’s new directions with interest.
Comprehensive plans have been outlined for the BRICS emerging market nations as Russia has started its presidency of the group from April till February 2016. Among the plans is creation of inter-parliamentary group and the priority to achieve strategic solutions to a full range of issues.
Valeria Gorbacheva, an Expert at the BRICS National Research Committee of the Rusian Federation, for instance, believes strongly that there is no doubt that inter-parliamentary cooperation among BRICS countries will be a significant part of the consolidation process. According to present knowledge, there is no parliamentary dimension in the pentalateral cooperation among BRICS countries, while bilateral inter-parliamentary relations are still underdeveloped.
In this regard, Indo-Russian inter-parliamentary initiative will become an important stimulus for this process. Russian side pay much attention to parliamentary dimension of BRICS and has already invited heads of two chambers of the Indian parliament to participate in the first BRICS parliamentary forum which is planned for June 8 in Moscow. Indian party promised to consider this invitation.
Russia is an active supporter of this process and Russian legislators hope that all BRICS countries will join the efforts on the development of inter-parliamentary cooperation. That is why within its presidency in BRICS, Russia will promote the creation of BRICS parliamentary assembly. This will definitely help BRICS to gain more and more strategic and long-term cooperation, according to objective views of Gorbacheva.
In the context of unilateral sanctions against Russia, this format of parliamentary cooperation can become a serious alternative to parliamentary platforms like those in PACE and OSCE. This is the reason why it is favorable to BRICS members to develop their coordination at the parliamentary level. Thus, BRICS parliamentary forum can become a new platform that will connect countries from three different continents, and countries which accumulate 42% of world’s population and 27% of world GDP.
Without doubts, Russia wants to help promote inter-parliamentary cooperation in every way possible and also intends to encourage cooperation between trade unions, civil society organizations, and youth movements. As stated by Russian Deputy Foreign Minister Igor Morgulov, the long-term aim is to transform BRICS from a “dialogue forum and tool of coordinating positions on a limited range of issues into a full-fledged mechanism of cooperation in the key issues of global economy and politics.”
If all sides agree to participate in the proposed inter-parliamentary summit, Russia will organize a meeting in Moscow on preparations for such an event. The first parliamentary summit of BRICS may take place in June in Russia, Chairman of the Russian Federation Council’s International Affairs Committee, Konstantin Kosachev told journalists in March.
“There are plans to hold a BRICS (Brazil, Russia, India, China and South Africa) parliamentary summit in Moscow in June this year,” Kosachev stressed. For now, only Chinese parliamentarians have given preliminary agreement to participate in the summit, he noted. “I have an order from the Federation Council chairperson to establish direct contacts with national delegations of India, Brazil and South Africa, in order to get an understanding about the colleagues’ plans,” Kosachev noted.
This could be one mechanism to strengthen the political cooperation of the BRICS grouping. But, as the inter-parliamentary group does not yet exist, judging its effectiveness is difficult says Hannah Edinger, a Director at Frontier Advisory (a research, strategy and investment advisory firm that assists clients to improve their competitiveness in emerging market economies) headquartered in South Africa.
The BRICS countries have a number of overlapping goals concerning global development, and cooperate across various platforms. More recently, they have sought to strengthen this by institutionalizing their cooperation through the New Development Bank.
“An inter-parliamentary group will add another dimension to the cooperation between the five states. The group will create a framework for discussions to take place regarding the resolution of conflicts and the reformation of existing international institutions, as part of the BRICS countries’ attempt to balance the current international economic system towards greater incorporation of the views of the emerging world. The first forum will be held in Russia in July this year at the seventh BRICS Summit,” Edinger wrote to Buziness Africa.
She argues that there may be initial challenges. “The creation of the BRICS inter-parliamentary group, which appears to be driven by Russia at the moment, will allow the BRICS countries to counter other parliamentary groups such as the EU. It therefore seems as though Russia is hoping that the BRICS parliamentary group will lend it legitimacy in light of its involvement in the Ukraine, by addressing questions of sovereignty and independence of states that differs from what it refers to as Euro-Atlantic doctrine,” says Edinger.
Professor Ramesh Thakur from the Crawford School of Public Policy at the Australian National University shares similar optimistic views about BRICS future development and its important role on the global arena. “BRICS is potentially of great significance as an alternative site of, and an actor in, global governance. It is both symptomatic of and will further consolidate an alternative grouping to the dominant Western-controlled institutions of global governance,” he told Buziness Africa media in April.
“The early initiatives are in international economic governance. But there is considerable political and strategic potential also. To that end, any further institutionalization of dialogue and interaction, such as a BRICS inter-parliamentary union, could help to solidify the group’s identity,” Professor Thakur stressed in his discussions with this researcher and writer.
In an email comment to Buziness Africa, Francis Kornegay, a Senior Research Fellow at the Institute of Global Dialogue, said that he was quite skeptical about a BRICS inter-parliamentary group. “I doubt that it will be taken seriously and could likely generate derisive feedback from any number of quarters given the democratic deficits of China and Russia. Neither country is a parliamentary democracy. Certainly not Beijing’s. Russia’s is a Potemkin parliament with little credibility under the clear personal rule of Putin,” he wrote further in his email.
“It is quite possible that the idea of such a group is simply one more attempt by China & Russia to make IBSA redundant as India, Brazil and South Africa are authentic parliamentary democracies and have an IBSA parliamentary forum. Also, the core business of BRICS is global economic governance reform, anything else suggesting a manifestly political programme is really a distraction. Global economic governance reform is the political as well as the economic agenda of BRICS. Not sure BRICS needs a parliamentary group for this,” Kornegay explained assertively.
The Institute for Global Dialogue (IGD) is an independent South African-based foreign policy think tank dedicated to the analysis of, and dialogue on the evolving international political and economic environment and the role of Africa and South Africa. It advances a balanced, relevant and policy-oriented analysis, debate and documentation of South Africa’s role in international relations and diplomacy.
Brazil’s sous-sherpa at BRICS, Director of Regional Mechanisms of the Foreign Ministry of Brazil, Flavio Damico, told TASS news agency at the end of March that the place and role of BRICS in the modern system of international relations “has been a significant factor in world affairs right from the moment of its establishment as countries in the group have big influence in decision-making on the international arena.”
“After they began coordinating their actions, their influence has grown even more,” the diplomat said. “Wide coordination between the BRICS countries became the new factor in the international life,” he added. The countries in the organization are “very large and complex,” and it is only logical that “there are spheres where coordination and cooperation are moving forward very fast and some spheres where more effort is needed to see tangible progress,” Damico said.
As a further step to consolidate the group’s footprint, Russian Prime Minister Dmitry Medvedev has ordered to sign a memorandum on cooperation with BRICS countries in the sphere of science, technologies and innovations, the official website of the Russian government reported in March. The memorandum aims at “forming a strategic system for cooperation in the sphere of science, technologies and innovations between countries-members of BRICS.” The memorandum will be signed by Russia’s Ministry of Education and Science on behalf of the Russian government.
According to the Ministry of Foreign Affairs of the Russian Federation official website, Russia has assumed the role as president in the BRICS bloc from April 1, 2015, to February 16, 2016. As the BRICS president, Russia in tandem with its partners, intends to take new and major steps towards transforming BRICS into a mechanism for coordinating strategic and routine actions on a broad spectrum of economic and international political issues.
Russia’s main priorities as the BRICS president are helping to consolidate strategic stability and regional conflict settlement, strengthening weapons of mass destruction non-proliferation regimes, fighting international terrorism and drug trafficking, and strengthening international information security.
The BRICS countries collectively represent about 26% of the world’s geographic area and are home to 42% of the world’s population. In 2013, the share of the BRICS countries reached 16.1% in global trade, 10.8% in military spending and 40/2% in production of non-renewable energy resources. The BRICS consumer market is the largest in the world and is growing by $500 billion a year. The next BRICS summit will take place in Ufa, the capital of Russia’s Volga republic Bashkiria, on July 8-10, 2015
Kester Kenn Klomegah is an independent researcher and writer on African affairs in the EurAsian region and former Soviet republics.
Related News


Building a coherent role for trade in the post-2015 development agenda
What role for trade, and how to build coherence between, the proposed sustainable development goals and the ongoing financing for development talks?
The final set of sustainable development goals and targets will need to be supported by a suite of means of implementation (MOI) measures, which are expected to be drawn in part from the outcome document of the Third International Conference on Financing for Development (FfD3) due to be held in Addis Ababa, Ethiopia in July. The post-2015 agenda and financing for development processes are interrelated in both substance and politics. Getting the goals and targets and support measures over the threshold in September is a delicate negotiating process that is still underway.
Trade-related targets and elements are currently present across the core documents linked to both processes. In an ideal scenario these trade elements would be internally and externally coherent.
To be internally coherent the trade elements of the post-2015 agenda should be mutually supportive. There is also a political element to this internal coherence. Given the breadth of the 17 proposed sustainable development goals, and the 169 targets under them, it is important that the financing for development outcome delivers an agenda that is just as ambitious as the goals themselves.
In terms of external coherence, the trade-related elements of the post-2015 development agenda should ideally not only reflect the global trading system as it is, but point to trade policy’s potential contribution to sustainable development through to 2030. Part of this contribution, for example, could be helping to manage the shift from commodity export-led growth to more diversified and sustainable production and consumption patterns.
A zero draft for the Addis Ababa outcome, prepared by co-facilitators of the preparatory process, usefully updates and fills in critical gaps left by the SDGs’ trade-related references. However, even when read together, the two documents do not yet point to a clear agenda for trade’s contribution to future sustainable development. This article analyses the trade references across both documents and suggests key additions that would help to fill out the broader vision.
Trade and the proposed SDGs
A proposed framework of 17 SDGs and 169 targets agreed in late July last year by a dedicated UN working group includes a variety of trade-related policy reforms – hereafter trade-related targets – that could contribute to different aspects of sustainable development.
The proposed SDG framework includes two kinds of targets. These are general targets whose accomplishment would lead to the achievement of a sustainable development goal and “means of implementation” (MoI) targets that identify enabling actions to support the achievement of other targets. Nearly all of the trade-related targets in the framework are classified as means of implementation. A target around fisheries subsidies in the proposed oceans goal is one exception to this rule.
Several trade-related targets are identified as MoI for specific sustainable development goals. The reform of distortions in agricultural markets, including export subsidies, and other perverse subsidies for fossil fuel consumption and production are listed under proposed goals 2 and 12. Increased support for Aid for Trade is one of only two MoI targets under proposed goal 8 on sustainable economic growth and employment. Several targets also refer to support for access to technology to help address social and environmental priorities, including access to clean water and sustainable energy.
Other trade-related targets are listed under proposed goal 17, “Strengthen the means of implementation and revitalise the global partnership for sustainable development,” as cross-cutting MoI. This means that they are geared towards achieving the framework as a whole. They include strengthening the multilateral trade system under the WTO and completing the Doha Development Agenda (DDA) round of trade negotiations. The targets also cover improving market access for developing countries including through duty-free, quota-free market access with simplified rules of origin (RoO) for exports from least developed countries (LDCs).
The SDG framework of goals and targets is now almost finalised. With 17 goals and 169 targets it is an extremely ambitious and wide-ranging agenda.
Trade in the financing for development zero draft
A zero draft for the financing for development outcome document, the Addis Ababa Accord, released on 16 March, lists eight areas where further action is needed to boost development finance. These include domestic public finance; domestic and international private business finance; international public finance; international trade for sustainable development; debt and debt sustainability; systemic issues; technology, innovation, capacity building; data, monitoring, and follow up.
The trade section in the current zero draft starts by providing a complementary narrative to the trade targets in the SDGs. It explains in paragraph 73 that “a universal, rules-based, open, non-discriminatory and equitable multilateral trading system and meaningful trade liberalisation can serve as an engine of economic growth and promote sustainable development,” while adding that flanking policies are also necessary, “with appropriate supporting policies, trade can also promote decent work, combat inequality and contribute to the realisation of the SDGs.”
The zero draft, building on the outcome documents of the two previous financing for developmental conferences, complements and adds to the trade agenda in the SDG targets in several important ways. First the zero draft expands on the scope of the SDG trade targets by including trade policy issues beyond multilaterally-agreed rules, explicitly referring to regional integration, regional trade agreements, and investment agreements. It also refers, albeit briefly, to the importance of domestic flanking policies to ensure that trade contributes to sustainable development outcomes. The zero draft also brings back into the post-2015 agenda the crucial issue of trade facilitation that was left out of the final proposed SDGs.
Multilateral trade system
At the multilateral level the zero draft reiterates several trade-related SDG targets, but adds references to recent WTO decisions, thus improving their external coherence. In paragraph 76 the zero draft reiterates the commitment in SDG target 2.b to correct and prevent restrictions and distortions in global agricultural markets, including removing all forms of agricultural export subsidies and disciplining measures with equivalent effect, but amends the target’s language slightly to reflect more precisely the 2005 WTO Hong Kong ministerial mandate.
The zero draft also reiterates in paragraph 78 the call in proposed SDG target 17.12 for implementation of duty-free quota-free (DFQF) market access for LDC exports, in accordance with relevant WTO decisions, including those taken at Bali. The zero draft would also have UN members “consider” simplifying preferential RoO for DFQF exports, which may be a wider, if less ambitious, target than language found in SDG target 17.12.
The zero draft in paragraph 77 would have WTO members reaffirm that special and differential treatment (S&D) is an integral part of WTO agreements, building on proposed SDG target 10.a, but goes further by adding a reference to the 2013 WTO Bali ministerial decision to establish a monitoring mechanism for S&D provisions. It also adds to the proposed SDG framework by calling in paragraph 76 for acceleration of developing country, particularly LDC, accessions to the WTO.
The final proposed SDG framework did not include references to trade facilitation. The zero draft usefully fills this gap by calling on WTO Members in paragraph 74 to ratify the 2013 WTO Trade Facilitation Agreement (TFA). This agreement focuses on the procedural aspects of trade facilitation, like customs systems, sometimes called “soft” trade infrastructure.* The zero draft complements the TFA by adding a focus on “hard” trade infrastructure in paragraph 79 by encouraging multilateral development banks and others to address gaps in regional trade and transport infrastructure.
Policy tensions around regional trade
Paragraphs 73 and 74 of the zero draft reiterate the SDG framework’s commitment to strengthening the multilateral trading system and to concluding the DDA but also emphasise, drawing on language from paragraph 281 of the Rio+20 outcome document, the importance of “meaningful trade liberalisation” as a driver of sustained economic growth. The zero draft then goes on to underscore the importance of regional integration and regional trade and investment agreements, both issues which were not explicitly covered in the proposed SDG targets.
The draft also appears to acknowledge that there are policy tensions associated with the creation of regional trade rules. The first tension relates to the fragmentation of the trade system. In paragraph 79 the zero draft includes commitments both to strengthen regional integration and, where relevant, regional trade agreements. At the same time paragraph 74 commits to strengthen the multilateral trading system and to work towards reducing fragmentation resulting from international trade and investment agreements.
The second tension relates to balancing the benefits of trade rules with the right to regulate for other policy objectives. In paragraph 81 the zero draft suggests transparent negotiation and implementation of regional trade and investment agreements will help to ensure the agreements do not constrain policymakers’ ability to address other sustainable development priorities, including addressing inequality, protecting the environment, or ensuring adequate tax revenues. The same paragraph would also see UN members commit to strengthen safeguards in investment treaties, through the review of investor-state-dispute-settlement (ISDS) clauses, in order to ensure policy space for social, economic, and environmental policy objectives.
Domestic policy frameworks
In paragraph 80 the zero draft calls on countries to “implement sound domestic policies and reforms conducive to realising the potential of trade for sustainable development.” This crucial addition underscores the importance of countries’ domestic policy frameworks for harnessing the benefits of trade for sustainable development. The national public finance section of the zero draft points to some relevant policies in this regard, including around transparent public procurement in paragraph 30, as well as the gradual elimination of harmful subsidies such as those to fossil fuel production and consumption in paragraph 33. Both of these issues are also reflected in some of the proposed SDG targets.
What’s missing?
Read together the proposed SDGs and the zero draft provide a comprehensive, but arguably incomplete, to-do list for trade’s contribution to sustainable development through to 2030. Some key elements that could be given greater priority are those that could support diversification of low-income economies. These include the reduction of trade costs, the importance of services, as well as support for building productive capacity to use the market access targeted in several of the proposed SDGs.
At a multilateral level it might be useful to articulate a role for the WTO beyond simply concluding the Doha Round and accelerating accessions. With respect to regional trade agreements, the financing for development outcome document could say more about how to address the two policy tensions hinted at in the zero draft. For example, the final outcome document could encourage governments to design regional agreements to be inclusive, to avoid, or limit potential fragmentation effects in the global trade system.
For low-income countries seeking to increase and diversify their exports, and become part of global value chains of production, reducing the costs of trade generally can be important. While the inclusion of trade facilitation in the zero draft is very welcome, experts have argued that having a specific reference to the reduction of trade costs could help to galvanise further action. Not only could this help to make exports more competitive but it could also widen the range of inputs available to produce those exports. Another element that could help to support the SDG targets on economic diversification and access to global value chains is an explicit reference to the importance of services both for domestic consumption and export.
More broadly, it would seem to make sense for the financing for development outcome document to underscore the importance of building productive capacity in low-income countries to trade both goods and services and explicitly link this to possible sources of support, such as Aid for Trade.
At a domestic level one area of perverse subsidies that is mentioned in the proposed SDG targets but not directly in the zero draft, despite its direct implications for sustainable development, is the reform of fisheries subsidies. Fishery trade is now woven into the reference to reform of distortions in agricultural markets, but this clouds the issue of agricultural market reform, and obscures the very real need to address harmful subsidies that contribute to unsustainable levels of fishing activity and distort global markets.
Trade visions
The proposed trade-related targets in the SDGs and the financing for development zero draft contain many of the key elements of a coherent trade agenda for sustainable development to 2030. Some gaps are nevertheless evident. The next fifteen years will present challenges and opportunities for many countries looking to manage the shift from commodity export-led growth to more sustainable and diversified production and consumption.
A coherent vision for trade’s contribution to the post-2015 development agenda could emphasise the importance of building diversified productive capacity and mobilise support to do so. It could include support for targets around access to global value chains by underlining the importance of reducing the cost of both exports and inputs and investing in services. It could point to an ongoing active role for the WTO through to 2030 and signal the importance of ensuring that, as far as possible, regional trade agreements are designed to be inclusive.
* Portugal-Perez, Alberto and John S. Wilson, 2010, Export Performance and Trade Facilitation Reform: Hard and Soft Infrastructure, World Bank Policy Research Working Paper, No. 5261.
Alice Tipping, Senior Programme Officer, Environment and Natural Resources Programme, International Centre for Trade and Sustainable Development (ICTSD). Tipping is also the Group Manager of the E15Initiative Expert Group on Oceans, Fisheries, and the Trade System and a member of the E15 Task Force on Subsidies.
This article draws on ideas discussed at ICTSD’s dialogue on Trade in the Post-2015 Agenda: Building coherence held on 31 March 2015.
Related News


Africa: End of the commodity super-cycle weighs on growth
Sub-Saharan Africa’s growth will slow in 2015 to 4.0 percent from 4.5 percent in 2014, according to World Bank projections released on Monday.
This downturn largely reflects the fall in the prices of oil and other commodities, notes Africa’s Pulse, a twice-yearly World Bank Group analysis of the issues shaping Africa’s economic prospects released on 13 April 2015 at the start of the World Bank Group’s 2015 Spring Meetings, which will draw the world’s finance and development ministers to Washington, DC, for talks on the state of the global economy and international development.
The 2015 forecast is below the 4.4 percent average annual growth rate of the past two decades, and well short of Africa’s peak growth rates of 6.4 percent in 2002-08. Excluding South Africa, the average growth for the rest of Sub-Saharan Africa is forecast to be around 4.7 percent.
“Despite strong headwinds and new challenges, Sub-Saharan Africa is still experiencing growth. And with challenges come opportunities,” says Makhtar Diop, World Bank Vice President for Africa. “The end of the commodity super-cycle has provided a window of opportunity to push ahead with the next wave of structural reforms and make Africa’s growth more effective at reducing poverty.”
African exports still dominated by primary commodities
Sub-Saharan Africa is a net exporter of primary commodities. Oil is the most important commodity traded in the region, followed by gold and natural gas. Over ninety percent of the total exports of eight major oil-exporting countries come from the three biggest exports of each country, which represent nearly 30 percent of their GDP. But the recent price declines are not confined to oil, and Africa’s Pulse reveals that the prices of other commodities are now more closely correlated both with oil prices and with one-another. As a result, terms of trade are declining widely among most countries in the region. The 36 African countries with expected terms-of-trade deterioration are home to 80 percent of the population and 70 percent of the economic activity in the region.
That said, the continent’s huge economic diversity is also mirrored in the impact of commodity price declines – even among oil producers. In Nigeria, for example, although the economy will suffer this year, growth is expected to rebound in 2016 and beyond, driven by a relatively diversified economy, and a buoyant services sector. Low oil prices will continue to weigh down on prospects of less diversified oil exporters such as Angola and Equatorial Guinea. In several oil-importing countries, such as Cote d’Ivoire, Kenya and Senegal, growth is expected to remain strong. In Ghana, still high inflation and fiscal consolidation will weigh on growth. In South Africa, growth continues to be curtailed by problems in the electricity sector.
Foreign direct investment inflows were subdued in 2014, reflecting slower growth in emerging markets and declining commodity prices. African countries continue to tap international bond markets to finance infrastructure projects: Cote d’Ivoire returned to the market this February; and Ethiopia had a debut issue in December 2014. Although debt burdens remain generally manageable, debt-to-GDP ratios for countries with increased bond market access have picked up in recent years. Uncertainty about future global monetary conditions are an additional reason for caution.
“As previously forecast, external tailwinds have turned to headwinds for Africa’s development. It is in these challenging times that the region can and must show that it has come of age, and can sustain economic and social progress on its own strength. For starters, recent gains for the poorest Africans must be protected in those countries where fiscal and exchange rate adjustments are needed,” says Francisco Ferreira, the World Bank’s Chief Economist for Africa.
New and Old Risks to Africa’s Economic Future
Persistent conflict in a number of areas, and recent violence by extremist groups such as Boko Haram and Al Shabaab pose security risks with the potential to undermine development gains. Also, the Ebola outbreak in Guinea, Liberia, and Sierra Leone has highlighted preexisting weaknesses in the health systems of the three most affected countries, as well as others.
Although substantial progress has been made against the Ebola epidemic, it remains premature to declare victory until there are zero cases left. A World Bank study released in January estimated that the three hardest-hit countries (Guinea, Liberia and Sierra Leone) will face at least $1.6 billion in forgone economic growth in 2015, and social costs in terms of nutrition, health and education are equally severe. The Bank Group has mobilized about $1 billion in financing to date for the three countries hardest hit by Ebola.
Policy Challenges Remain
The fiscal policy stance is expected to remain tight throughout 2015 in most net oil-exporting countries across the region, as countries take measures to rein in spending in light of anticipated lower revenues. While capital expenditures are expected to bear the brunt of expenditure measures, recurrent expenditures, including fuel subsidies, will also be reduced. Despite these adjustments, fiscal deficits are likely to remain high. Fiscal deficits are also expected to remain elevated in net oil-importing countries.
“Large fiscal deficits and inefficient government spending remain sources of vulnerability for many countries of the region. It is urgent that these countries strengthen their fiscal positions and fortify their resilience against external shocks,” says Punam Chuhan-Pole, a World Bank Lead Economist for Africa and co-author of Africa’s Pulse.
Beyond macroeconomic policies, the report stresses the need across the region for structural reforms to ignite and sustain productivity growth in all sectors, and to foster a job-creating, inclusive process of structural transformation. Boosting fundamentals such as lower transport costs, cheaper and more reliable power, and a more educated and skilled labor force will benefit all sectors.
In fiscal year 2015, the World Bank delivered $15.7 billion in new lending for over 160 projects across Africa. They include a new record of $10.2 billion in zero-interest credits and grants from the International Development Association (IDA), the World Bank’s fund for the poorest countries, representing the highest level of IDA delivery by any region in the World Bank’s history.
Related News


Regional importers could lose unclaimed goods at Mombasa as waiver expires
More than 2,000 containers that have overstayed at the Mombasa port are set to be auctioned after the storage-charge waiver given to importers expires Tuesday.
On February 14, the Kenya Revenue Authority (KRA) announced that the government would waive all charges accruing on the storage of containers discharged at the port before November 30, 2014, provided they were cleared within 60 days.
“All such goods that will not have been removed from the port and Container Freight Stations (CFSs) upon expiry of the 60-day notice shall be sold by public auction without further reference to the owners,” KRA said in the notice.
The move was prompted by the high number of containers lying at the port, some of which have remained there for over 10 years, holding up space at the CFSs and port yards.
But even as the waiver expires, the few number of containers cleared over the past 60 days has sparked controversy, with a section of industry players saying it was ‘cosmetic’ and was meant to open a window for illegal auctioning of the cargo.
Bureaucracy
Some importers said they were yet to clear their cargo due to bureaucracy and refusal by some CFSs and shipping lines to waive the charges.
By yesterday, KRA could not state how many containers had so far been cleared during the waiver period, with Fatma Yusuf, the officer in charge of marketing and communication, saying they were still compiling data.
While multiple sources at the port indicated that the containers could be in the range of 2,000 and 2,500 in number, it was not immediately possible to establish the number of containers being held at CFSs.
According to information obtained from KPA, only 53 applications had been received for processing before the release of the cargo.
Of these, 36 were destined to Uganda, 11 to Kenya, two to Rwanda and one to Burundi, according to a Kenya Ports Authority (KPA) official who declined to be named.
George Kidima, a Ugandan business representative in Mombasa, claimed that some CFSs were not offering the waiver as directed, but gave only a 20 per cent discount.
“Some containers have accrued over $200,000, yet the goods themselves are not worth that much so if one is given only 20 per cent discount it beats the logic of a waiver,” he said.
He added that while KPA and KRA were giving a 100 per cent waiver, other stakeholders were not doing so, hindering the clearing process.
However, CFS Association of Kenya executive officer Daniel Nzeki denied the claim, saying they had instructed all the facilities to waive the charges, and maintained that he was not aware of any facility that had refused to heed the directive.
Kidima also said since some shipping lines had declined to give the waiver, importers could not collect the cargo that had accrued high fees.
Once cargo has been delivered to its destination, empty containers are supposed to be returned to the shipping line within a free period of 14 days for local and up to 45 days for transit cargo, failure to which it attracts a charge (called demurrage).
Shipping lines charge these fees differently, and according to Kidima, it ranges between $7 and $14 per day, depending on the size of the container.
No information
“There are shipping lines that complied with the directive but others did not.
“Also, some importers in the interior parts of Uganda and Rwanda were not informed about the waiver early enough, so I think there is a need to extend it,” said Kidima, adding that during the waiver period, they had cleared less than 30 containers destined to Uganda.
But Kenya Ship Agents Association (KSAA) executive officer Juma Tellah defended the shipping lines, saying none had declined to offer the waiver so long as importers or their agents turned up with the correct documentation.
“Some of them went to the shipping lines with the notice as it was published in the newspapers and that is the reason it (waiver) was denied.
“They should know that proper procedures must be followed,” he said.
The Intergovernmental Standing Committee on Shipping (ISCOS) also raised concerns about the cargo, saying the presence of uncleared goods was resulting in congestion and inefficiency at the port, and increased the cost of doing business in the region.
“ISCOS supports the initiative to decongest the port of Mombasa and advises all shippers with overstayed cargo to take advantage of the amnesty and clear their cargo,” said the organisation’s secretary, Kenneth Mwige.
When he visited stakeholders in Uganda early last month, KPA managing director Gichiri Ndua noted that long stay containers at the port occupied space at the yards unnecessarily and appealed to the owners to collect them, noting that importers in Uganda were not utilising the liaison office.
“Despite us having an office in Kampala, we find many importers are still least informed about what is happening at the port and along the Northern Corridor. Equally, they still direct their complaints directly to Mombasa instead of having them sorted out in Kampala,” he said.
At the time, according to the MD, there were 2,435 containers destined for Uganda that had stayed at the port for over 21 days with 293 of them having been at the port for more than three months.
Meanwhile, Fred Seka, the chairman of the Rwanda Freight Forwarders and Clearing Agents Association, said auctioning the goods will greatly impact on local importers. Over the 60-day grace period, an unspecified number of containers belonging to Rwandan importers were cleared, according to reports.
However, Seka said he was aware of two containers still at the port of Mombasa.
“The owner of one of the containers in question was asked to pay $28,000 (Rwf20.3 million) as storage fees,” Seka told Business Times last evening.
Rwanda-bound cargo through the Kenyan port dropped in 2014 to 235,912 tons from 240,099 tons in 2013.
Related News


16 ECOWAS countries begin uniform tariff regime for imports
Sixteen countries within the Economic Community of West African States (ECOWAS) may have started the implementation of uniform tariff on imports, beginning from 11 April 2015.
The tariff, set at 35 percent at most, will modify the rights and obligations of ECOWAS member countries under the Common External Tariff (CET). In Nigeria, government has directed immediate enforcement of the new tariff regime which put duty payable on imported items at 0 per cent for social and necessary items, 5 percent for raw materials, 10 per cent for intermediate goods, and 20 per cent for finished goods that are not produced locally.
Nigeria was granted the possibility of adding a fifth band of 35 per cent for finished goods manufactured locally under the new dispensation that is expected to be reviewed in 2019.
The directive to implement the regional tariff regime in Nigeria was conveyed to the Customs high command yesterday by the coordinating minister of the Economy and Minister of Finance, Dr Okonjo Iweala.
The Customs spokesman, Wale Adeniyi, said on Saturday that it was now mandatory for all stakeholders to fall in line with the new tariff regime, saying it would enhance trade facilitation within and outside the region.
The implementation of the ECOWAS CET (2015-2019) together with its Supplementary Protection Measures (SPM) and 2015 Fiscal Policy Measures are being implemented concurrently and took effect from Saturday, after the expiration of the 30 days notice required under the provisions of the ECOWAS Common External Tariff (CET).
By this development, all imports arriving into the country shall be subjected to the rates contained in the CET 2015-2019 and 2015 Fiscal Measures without recourse to the rates applicable before the coming into effect of the ECOWAS CET 2015-2019.
The approved Supplementary Protection Measures (SPM)/Fiscal Policy Measures an Import Adjustment Tax (IAT) list, which involves additional taxes on 177 Tariff Lines of the ECOWAS CET, a National List consisting of items whose Import duty rates have been reviewed to encourage more development in strategic sectors of the economy, an Import Prohibition List (Trade) and applicable only to certain goods originating from non-ECOWAS Countries.
This may create a contradiction between the World Trade Organisation (WTO) commitments of individual countries and the requirements of the regional trade integration project essential for West Africa’s economic development.
Following the adoption of the CET, Nigeria’s simple average tariff on agricultural imports dropped from about 32 per cent in 2000 to 15 per cent in 2010, while its tariff on manufactured products fell from 25 per cent in 2000 to 11 per cent in 2010. Nigeria accounts for more than half of the sub-region’s imports.
In nominal terms, its total imports increased from USD 6 billion in 1990 to USD 64 billion in 2011, while ECOWAS’s total imports rose from USD 14 billion in 1990 to USD 111 billion in 2011 according to United Nations Conference of Trade and Development (UNCTAD).
In terms of import composition, Nigeria accounted for 40 per cent of ECOWAS’s agricultural imports in 2009 and 79 per cent in 2011, while its industrial imports represented 79 per cent and 65 per cent of those of ECOWAS in 2009 and 2011, respectively.
These data confirms the huge trade impact of Nigeria on the sub-region and explains its late and reluctant acceptance of the ECOWAS CET.
The CET is said to be incompatible with the individual commitments with WTO. WTO data clearly shows that the application of the ECOWAS common external tariff – both for agriculture and industry – would be a problem with regard to respecting the individual commitments undertaken by the group’s members at the multilateral level.
All West African countries have lower applied agricultural tariffs than those they have bound at the WTO. Nigeria, for instance, has bound its tariff for agricultural products at 150 percent, while its applied tariff is only 33.6 percent. The common external tariff is a mild form of economic union but may lead to further types of economic integration.
In addition to having the same customs duties, the countries may have other common trade policies, such as having the same quotas, preferences or other non-tariff trade regulations apply to all goods entering the area, regardless of which country, within the area, they are entering.
Related News


China’s influence over AIIB a concern ahead of founders’ meeting
China could have outsized influence over a new Beijing-backed international development bank under a proposed shareholding structure likely to be discussed at a meeting of member nations in Washington this week, sources say.
The group will meet on the sidelines of the annual meetings of the International Monetary Fund and World Bank in the U.S. capital, said an Indian government official familiar with the plan. India was one of the first nations to join the new bank.
China has proposed that Asian nations own three-quarters of the Asian Infrastructure Investment Bank (AIIB), a larger overall stake than would be warranted were ownership decided by economic weightings alone, given European heavyweights Germany, France, Britain and Italy are also members.
Each Asian member will then be allotted a share of that 75 percent quota based on their economic size, two Japanese sources said – a formula that would guarantee China the largest single voice inside the bank.
China has outlined details of the bank to Japan in an effort to get Tokyo to sign up, the sources said. However, Tokyo remains non-committal due to its close relationship with the United States, which has urged nations to be wary of the AIIB.
“Looking at GDP-based contributions, if the No. 1 and No. 3 (the United States and Japan) aren’t in, then China will have an overwhelmingly large quota and voice,” said one Japanese official. “No country would be able to challenge China. If Japan were in, it would have considerable influence.”
China’s finance ministry did not immediately respond to a request for comment.
The United States had earlier cautioned nations about joining the bank, citing what it called a lack of transparency and doubts about lending and environmental safeguards, and how much influence Beijing would wield.
But its major allies – Britain, France, Germany, Australia and South Korea – signed up anyway.
NOT A POLITICAL ALLIANCE
Jin Liqun, secretary-general of China’s interim secretariat which is establishing the AIIB, said at a forum in Singapore on Saturday that although China would have the biggest share in the bank, it would not dominate its operations.
“AIIB is a bank, not a political organisation or political alliance,” Jin was quoted as saying by China’s official Xinhua news agency. He said the AIIB would be “clean, lean and green”.
China has said it will announce the AIIB’s list of founder members on Wednesday, but it is not clear if the shareholding structure will also be finalised this week.
The Indian official said Asia’s total ownership would be between 70 and 75 percent depending on whether Japan joined or not.
A detailed method of determining the breakdown of national shareholdings had yet to be decided, though it could be based on a country’s nominal gross domestic product or its GDP calculated on a purchasing-power-parity basis, or a mixture of the two. Purchasing power parity would give more weight to developing nations than to rich economies such as Japan.
The AIIB has drawn applications from more than 50 nations from Asia, Europe and the Middle East despite U.S. misgivings.
Beijing says it will not hold veto power inside the AIIB, unlike the World Bank where Washington has a limited veto.
Beijing has also said a board of governors will control the operations of the new bank. Founder members will initially pay up to one-fifth of the AIIB’S $50 billion authorised capital, which will eventually be raised to $100 billion.
Brazil, Russia, India, China and South Africa will also hold a meeting in Washington this week to iron out details of another international development bank, the $100 billion BRICS bank launched last year, officials in Brasilia and Moscow said.
“The idea is that everything will be ready for 2016,” said an official in Brasilia, adding that governance issues will be taken up in Washington.
Related News


U.S. Commerce Secretary hosts inaugural Africa Advisory Council Meeting
Council established by President Obama meets to help fulfill his commitment to the continent
U.S. Secretary of Commerce Penny Pritzker on 8 April 2015 hosted the first meeting of the President’s Advisory Council on Doing Business in Africa (PAC-DBIA) to discuss initial recommendations on ways to strengthen commercial engagement between the United States and Africa. The council, established by President Obama last year during the first-ever U.S.-Africa Leaders Summit, advises the President through the Secretary of Commerce, on advancing his DBIA campaign as described in the U.S. Strategy Toward Sub-Saharan Africa of June 14, 2012.
During today’s meeting, the PAC-DBIA provided guidance and drafted suggestions in an effort to promote broad-based economic growth in the United States and in Africa that will encourage U.S. companies to trade with and invest in Africa.
“Our gathering today is part of the Administration’s effort to write the next paragraphs in what President Obama called a ‘new chapter in U.S.-Africa relations,’” said U.S. Secretary of Commerce Penny Pritzker. “We are building upon what was started at the historic U.S.-Africa Business Forum last August when U.S. firms announced more than $14 billion worth of investments in African markets. I look forward to working with this Council to make doing business in Africa easier for U.S. companies, and to keep America and Africa open for business together.”
The PAC-DBIA is comprised of 15 members representing small, medium, and large companies from a variety of industry sectors. The council’s initial recommendations focus on: investment and access to capital; trade and supply chain development; infrastructure; and marketing and outreach. The council touts efforts to enhance the ability of U.S. companies to compete for major projects with a dedicated U.S.-Africa Infrastructure Center; support capacity building activities for African financial regulators and exchanges through training programs, partnerships, and knowledge sharing; and to improve the perception of doing business in Africa and highlight trade opportunities through an online Doing Business in Africa toolkit and targeted outreach events.
In addition to establishing the PAC-DBIA, other commitments made during the U.S.-Africa Leaders Summit are progressing. To date, of the $7 billion in commitments that the U.S. government made in August, approximately $3.3 billion (47 percent) has been authorized. Also, $1.75 billion of the $7 billion is on track to be approved by the end of the fiscal year.
The United States Trade and Development Agency and the Department of Commerce have completed four trade missions and reverse trade missions. Seven additional missions are planned, including a trade and investment mission jointly led by the Millennium Challenge Corporation and the Department of Commerce to Tanzania in June, and the Department of Commerce’s Trade Winds Mission and Conference starting in South Africa in September.
From 2011 to 2014, the United States closed its trade gap with sub-Saharan Africa by 97 percent. U.S. merchandise exports to sub-Saharan Africa increased 19 percent during this period, reaching $25.4 billion last year. The annual growth rate of U.S. goods exports to sub-Saharan Africa averaged nearly 6 percent, almost doubling the average annual rate of growth to the world during this same period.
For more information on PAC-DBIA, please visit www.trade.gov/pac-dbia.
Related News


SACU threats must signal warning bells
As the Southern African Customs Union (SACU) revenue sharing formula debate rages on, it would be best for Swaziland to start exploring other trade options within the region to increase its revenue base, experts have advised.
In the past few weeks, South Africa has been voicing out its discontent on the revenue sharing formula, arguing that it loses about E30 billion that it would otherwise be entitled to if the distribution of revenue were equitable. In a commentary about tax proposals for the 2015 South African budget, accounting firm PwC slammed the revenue sharing formula agreed to by SACU, arguing that a more equitable sharing of the customs revenue pool would see South Africa entitled to at least 80% of the pool.
Economist Christopher Fakudze said Swaziland needed to improve its terms of trade via the Common Market for Eastern and Southern Africa (COMESA) provision as an alternate trade arrangement.
“We need a shift in the mindset from direct dependence on the external revenue pool (in the SACU context) to other collection strategies derived from expanded quantities of produce that take care of virtually all WTO (World Trade Organisation) commodity nomenclatures,” he said.
Fakudze said the idea was to go full-swing in trade participation, of course, “bearing in mind that we are yet to learn lessons from the Swaziland experience”.
The 105-year-old customs union agreement between the member states; South Africa and Botswana, Lesotho, Namibia and Swaziland (BLNS) distributes revenue collected on import duties and excise based on a number of criteria. The import duty revenue is collected on all imports coming into the customs union from outside. Excise duties are distributed by the members based on the share of the gross domestic product (GDP) of the countries involved. The excise revenue goes mostly to South Africa, which is by far the largest economy, but import duties are distributed based on a formula that calculates each country’s portion based on its share of intra-SACU imports.
This results in the bulk of the revenues going to the BLNS countries because they export almost nothing to South Africa and import almost everything from South Africa.
South Africa argues that in 2014, it exported E132 billion to the four countries, but imported only E28 billion. The ‘big brother’ further says the E104 billion surplus, therefore, formed the basis for what is, in effect, a massive export subsidy to the BLNS countries. “All the member states have a key interest in a future SACU that does not regress on regional Integration,” said another local economist, who preferred anonymity. “Economically, the BLNS countries cannot survive without South Africa’s support and politically, South Africa cannot afford to have any more failed states on its doorstep.”
Outcome
He said the outcome of SACU’s current dilemma would also affect the broader regional integration agenda, adding that if regional integration is seen to result in tangible benefits for participants, a strengthened SACU could have positive spin-off effects for the Southern African Development Community (SADC), COMESA and the tripartite process.
Experts say all the SACU member states have to grapple with a key policy debate, that of SADC’s ambition to eventually become a customs union as the five SACU countries are all members of SADC, while Swaziland is also a member of COMESA, which launched its own customs union in June 2009.
“Unless Swaziland acts like Ethiopia, which currently applies a 10% reduction on tariffs and has commissioned a study to estimate the effect of further reductions on the national economy, the SACU threats might create hazards for Swaziland,” said Fakudze. He said this was more especially because Namibia and Swaziland were currently consulting SACU so as to comply with their obligations of tariff reduction.
Adding, Fakudze said the most important implication to monitor was a bridge of any of the treaties, as most believed it was quite strange to be a member of multiple customs unions.
Asked on the implications for Swaziland if it were to be pressured into choosing one customs union, he said; “Some caution would have to be exercised whenever there is an undertaking.
“Otherwise, both customs unions stand to oppose any subsidies that distort or threaten to distort competition in the form of preferential treatment to the producers to encourage the production of a particular commodity or taking certain steps that would affect inter-trade between member countries.”
Fakudze said, for instance, any member country was entitled to apply a compensation fee on an imported product from another member country to counteract a direct or indirect subsidy amount imposed on exports or production of similar products in the country of origin according to the regulations set by the council.
Adding, another economist said the collapse of SACU could either be a move away from integration or strengthen SADC, as the foremost regional organisation that also includes South Africa.
Noted
It must be noted that while the COMESA customs union was launched in 2009, implementation has somewhat stalled. Former Uganda Revenue Authority Customs Commissioner Peter Malinga, who later worked for COMESA, said the European Union (EU) eventually withdrew its technical support after five years of no progress.
“This was after the first three years elapsed and COMESA was given a two-year extension for implementation of the customs union, which also elapsed, resulting in the funds being withdrawn,” he said recently during a workshop in Arusha, Tanzania.
Malinga said there was no outcome even after five years of the process but “just meetings held and nothing tangible being done, hence no implementation”. However, a Tripartite Free Trade Agreement between and among SADC members and COMESA is envisaged to be launched in June this year, with expectations of a larger market of around 625 million people, representing 58% of Africa’s GDP.
Related News


Putting trade at the heart of poverty-reduction policies in Africa
Sixty policy makers from 15 least developed countries in Africa came together to discuss mainstreaming trade into national policies aimed at reducing poverty.
A regional workshop on mainstreaming trade into national policies aimed at reducing poverty in least developed countries (LDCs), was organized by UNCTAD in Maseru, Lesotho on 31 March-1 April 2015.
The workshop was part of a project that UNCTAD's Division for Africa, Least Developed Countries and Special Programmes (ALDC) is implementing jointly with the Division on International Trade, Services and Commodities (DITC) to assist LDCs to better coordinate their trade policies and benefit from trade.
The workshop reviewed the national studies of the three pilot countries in Africa to arrive at a clear understanding of the mainstreaming trade measures into national policies, and the constraints facing the countries in their efforts to make trade an engine of growth and poverty reduction.
At the end of the workshop, recommendations on possible strategies and options to address these challenges were identified.
Mainstreaming trade into national plans and poverty-reduction measures involves the systematic promotion of mutually reinforcing policy actions across government department and agencies, creating synergies in support of agreed development goals.
Building productive capacities was identified as a critical element for the effective mainstreaming of trade policies into poverty-reduction measures, and in this context the key role of the Enhanced Integrated Framework (EIF) in supporting the trade mainstreaming process was emphasized. The EIF is a multi-donor programme, which assists LDCs in their efforts to play a more active role in the global trading system.
At the workshop representatives of the UNDP, the United Nations Department of Economic and Social Affairs and the EIF Secretariat briefed participants on the activities they undertake in support of LDCs.
Representatives of the following LDCs attended the event: Benin, Burundi, Chad, Djibouti, Ethiopia, Gambia, Guinea, Lesotho, Mali, Mozambique, Niger, Rwanda, Senegal, Uganda, and Zambia.
“Successful mainstreaming requires leadership, clarity of responsibility, a vision and political will to implement policies as planned,”Geremew Ayalew, Director General of the Trade Relation and Negotiation Directorate of the Ministry of Trade and Industry of Ethiopia, said.
The project focuses on six pilot countries, three from Africa (Ethiopia, Lesotho and Senegal), and three from the Asia-Pacific region (the Lao Peoples’ Democratic Republic, Kiribati and Myanmar). Ultimately it will form the basis of a manual that will guide LDCs that wish to place trade policy at the heart of their national development strategies.
Related News

The fiscal role of multinational enterprises: towards guidelines for Coherent International Tax and Investment Policies
Intense debate is ongoing in the international community on the fiscal contribution of multinational enterprises (MNEs). The focus is predominantly on tax avoidance – notably in the G20/OECD project on Base Erosion and Profit Shifting (BEPS).
Policymakers and experts at work in the BEPS process have so far not quantified the value at stake for government revenues, nor have they established a baseline for the actual contribution of MNEs. We estimate the contribution of MNE foreign affiliates to government budgets in developing countries at $730 billion annually. This represents, on average, around 10% of total government revenues. Contributions through royalties on natural resources, tariffs, payroll taxes and social contributions, and other types of taxes and levies are twice as important as corporate income taxes.

Notwithstanding their overall role as contributors to government revenues, MNEs, like all firms, aim to minimize taxes. MNEs build their corporate structures through cross-border investment. They will do so in the most tax-efficient manner possible, within the constraints of their business and operational needs. The size and direction of foreign direct investment (FDI) flows are thus often influenced by MNE tax considerations, warranting an investment perspective on tax avoidance.
Such an investment perspective puts the spotlight on the role of offshore investment hubs as major players in global investment. Around one-third of cross-border corporate investment – FDI, plus investments through Special Purpose Entities (SPEs) – is routed through offshore hubs before reaching its destination as productive assets. (UNCTAD FDI data excludes SPE investments.)
The root-cause of the outsized role of offshore hubs in global corporate investments is tax planning, although other factors can play a supporting role.MNEs employ a wide range of tax avoidance levers, enabled by tax rate differentials between jurisdictions, legislative mismatches, and tax treaties. MNE tax planning involves complex corporate structures which often rely on entities in offshore hubs.
Tax avoidance practices by MNEs are a global issue relevant to all countries: the exposure to investments from offshore hubs is broadly similar for developing and developed countries.However, profit shifting out of developing countries can have a significant negative impact on their sustainable development prospects. Developing countries are often less equipped to deal with highly complex tax avoidance practices because of resource constraints or lack of technical expertise.

The leakage of development financing resources is significant. An estimated $100 billion of annual tax revenue losses for developing countries is related to inward investment stocks directly linked to offshore hubs. The estimated tax losses represent around one-third of corporate income taxes that would be due in the absence of profit shifting.
The aggregate figures disguise country-specific impacts. Tax avoidance practices by MNEs and international investors lead to basic issues of fairness in the distribution of tax revenues between jurisdictions that must be addressed. At a particular disadvantage are countries with limited tax collection capabilities, greater reliance on tax revenues from corporate investors, and growing exposure to offshore investments.
However, in tackling tax avoidance, policymakers should be aware that the potential value at stake – taking into account the total contribution of MNEs as well as the fiscal discounts actively provided by governments in the form of incentives to attract investment – is almost ten times larger than the revenue leakage. This is not considering the value at stake in terms of much needed new productive investments.
Taking action on tax avoidance will have effects on international investment that must be considered carefully. Ongoing anti-avoidance discussions in the international community pay limited attention to investment policy. On the one hand, the role of investment in building the corporate structures that enable tax avoidance is fundamental. Therefore, investment policy should form an integral part of any solution. On the other, any policy initiative tackling tax avoidance by international investors is likely to affect national and international investment policies.
A set of principles and guidelines for Coherent International Tax and Investment Policies may help realize the synergies between investment policy and initiatives to counter tax avoidance. Key objectives of the 10 guidelines we propose for discussion include: removal of aggressive tax planning opportunities as investment promotion levers; mitigation of the impact on investment of tax avoidance measures; recognition of shared responsibilities between investor host, home and conduit countries; acknowledgement of links between international investment and tax agreements; and understanding of the role of both investment and fiscal revenues in sustainable development.
» Read a summary of the new UNCTAD report by Alex Cobham: UNCTAD study on corporate tax in developing countries
