News
Trade data discrepancies: South African exports to the USA versus US imports from South Africa

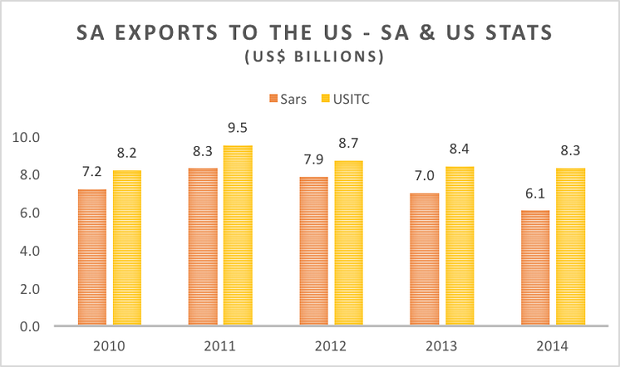
The South African Revenue Service puts the value of SA exports to the US in 2014 at ZAR 70.4 billion, or around $6.1 billion based on that year’s average exchange rate of ZAR 11.20 to the dollar. The US International Trade Commission’s Dataweb values US imports from SA in 2014 at $8.3 billion. That’s a $2.2 billion difference.
The phenomenon isn’t new, as the chart indicates, but the gap does seem to be widening. Is there an innocent explanation, asks IZWI.com? Or is this evidence that SA exporters are under-invoicing to get money out of the country and/or to hide income from SARS? According to the Washington-based NGO Global Financial Integrity, illicit financial flows out of SA were the seventh highest in the world 2004-13, averaging $21 billion a year and trailing only the other BRICS, Malaysia, and Mexico.
Comment from Ron Sandrey, tralac Associate
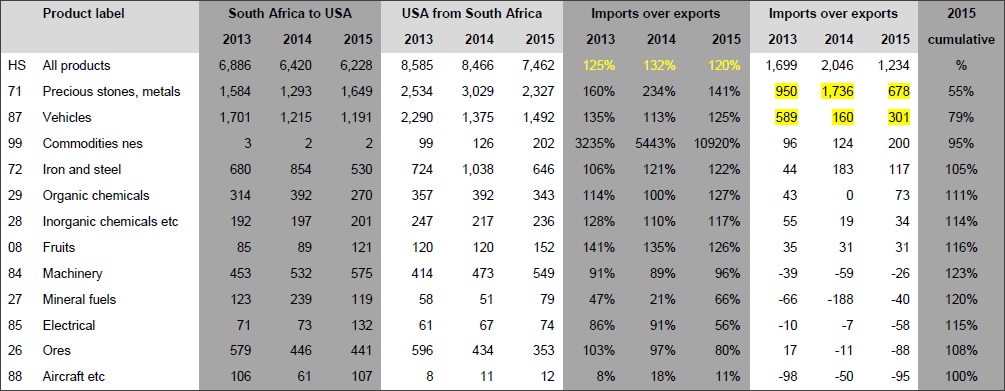
The table below shows data ($ millions) for the last three years. It is sourced from the USITC database, who in turn source it from the country authorities. Note that 2015 data is included. The aggregate data seems close to that given for the 2013 and 2014 years.
HS codes and products at an aggregated level on left
Then trade as South Africa to USA (exports)
Followed by USA from South Africa (imports)
Differences expressed as % of imports relative to exports. Note that we would expect this to be perhaps 110% as imports includes transport and related costs. The levels are ‘relatively’ consistent. Note also some big differences further down. Especially HS 99, commodities not elsewhere specified (Generally looks as though it is exports of gold as gold is not reported by South Africa, and this would possibly also impact on the next trade line of precious metals and stones).
Next is the difference expressed in $ millions. Here the two big differences are precious stones etc and vehicles.
Finally on the right hand side the cumulative $ million ‘discrepancies’ are shown. The first two entries account for 79% of the total.
Note at the bottom of the table there are some lines where exports are more than imports. Aircraft stands out, although one has to be careful with aircraft as sometimes they are leased and not purchased and maybe should not be in trade data (rather balance of payment data)
This is the big picture profile. To get more information one would need to look at respective trade volumes at the detailed level. Trade data says nothing about the legality or otherwise of the monetary flows.
Find out more in a recent tralac Working Paper by Cyril Prinsloo and Ron Sandrey: Black holes in African trade data


