News
World Economic Situation and Prospects 2015: International Trade

Trade flows
World trade flows, measured in terms of import volumes, continued to grow at a slow pace in 2014, expanding at about 3.3 per cent, slightly faster than in 2013 but still well below the long-term trend of the decades before the global financial crisis. In the two decades prior to the crisis, for instance, the annual growth of world trade, measured by imports in volume, was on average twice the growth of world gross product (WGP), although trade flows were characterized by much higher volatility than WGP. The eruption of the global financial crisis in 2008 and the subsequent Great Recession in 2009 led to a collapse in world trade flows, with the volume of world imports plummeting over 11 per cent in 2009, 5 times the percentage decline in WGP. Except for a strong rebound in 2010, world trade has been expanding at a sluggish pace during the recovery, at only about the same rate as WGP. In the forecast period, trade growth is expected to expand moderately, at a pace of 4.7 per cent in 2015 and 5.0 per cent in 2016. While this will be an improvement, the ratio of the growth of world trade to that of WGP will still be only 1.5, not a full recovery to the pre-crisis trend.
At issue is whether the slowdown in trade growth relative to WGP in the years since the global financial crisis reflects a fundamental change in the structure of the global economy, or a transient and cyclical change in the relationship between trade and gross domestic product (GDP). The answer is probably that both cyclical and structural changes are at play.
Some of these key factors driving the growth of world trade before the global financial crisis may have run their course. The WTO Doha Round of multilateral trade negotiations, for example, has made little progress in the past fourteen years, failing to provide new impetus to trade growth. Some may argue that the Doha Round has been at an impasse since 2001, but world trade still registered high growth in the years before the financial crisis of 2008. This is because world trade in the run-up to the crisis continued to benefit from the lagged effects of the trade liberalization of the earlier years. For example, although China’s accession to the WTO occurred in 2001, China had a grace period of five years to gradually remove or lower a large number of trade barriers. By now, the lagged benefits from the earlier trade agreements before the Doha Round may have tapered off. The proliferation of various regional trade agreements (RTAs) may generate some new trade flows in some regions, but the overall effects of RTAs on world trade in the long run are not certain and cannot replace the role of the multilateral trading system (see the section on trade policy).
The integration process of the economies in transition and China into the global economy, after accelerating in the 1990s and 2000s, may also have reached a steady state. For instance, after two decades of rapid growth in its exports, at an annual rate of above 20 per cent, China’s share in total world trade has increased from a small fraction to about 12 per cent, in line with its share of GDP in WGP. With its wages increasing markedly, its process of transferring labour from the agricultural sector to the manufacturing sector diminishing, and its restructuring towards the services sector, as well as the rising environmental costs associated with industrialization, China’s growth in exports is not expected to return to a double-digit pace. On the positive side, the rise of the African economies can provide a renewed impetus to world trade in the next decades, but it will take some time to see the results on a large scale, as the region’s share in world trade is still small, at about 3 per cent.
In short, growth of world trade is projected to pick up some momentum from the subdued pace of the past few years in the aftermath of the financial crisis, but the dynamism of the two decades before the crisis may not return soon.
Regional trends
Growth of exports from developing countries is expected to increase from 3.9 per cent in 2014 to 4.6 per cent in 2015 and 5.5 per cent in 2016, while growth of imports will expand similarly from 3.8 per cent in 2014 to 5.3 and 6.0 per cent in 2015 and 2016, respectively. Africa’s exports continued to be relatively weak in 2014, growing only by 2.0 per cent. This weakness was driven by a variety of factors, including slow growth in North Africa and persistent fragility in Central Africa. Tourism and commodity exports have also been slowed by a number of factors, including the Ebola outbreak, terrorist attacks and domestic and political turmoil. This is expected to reverse somewhat in the forecast period with export growth rising to 4.6 per cent in 2015 and 5.0 per cent in 2016, driven by a reversal in North Africa to positive export growth, continued robust growth in East and Southern Africa and improvements in West Africa. Import growth is expected to continue strengthening after rising to 5.4 per cent in 2014, up to 7.0 per cent by 2016.
Trade decomposition
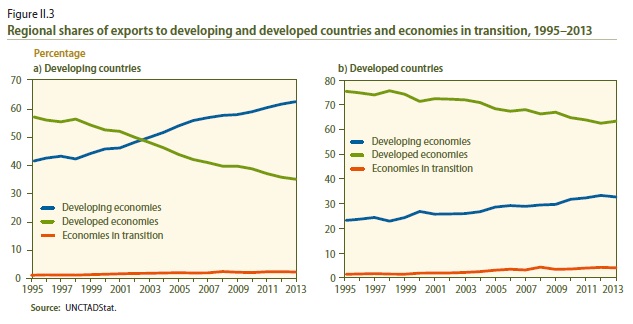
Many of the shifts in trade patterns that were observed over the past few decades continued in 2014, with developing countries exporting an increasing share of world trade by value, particularly manufactured goods. The destination of exports points to a more pronounced shift, as developing countries export a higher share to other developing countries than in the past, with a comparable fall in developed-country exports to developing countries. By contrast, the shift in exports to developed countries has been considerably lower, and developed countries still export most of their goods to other developed countries.
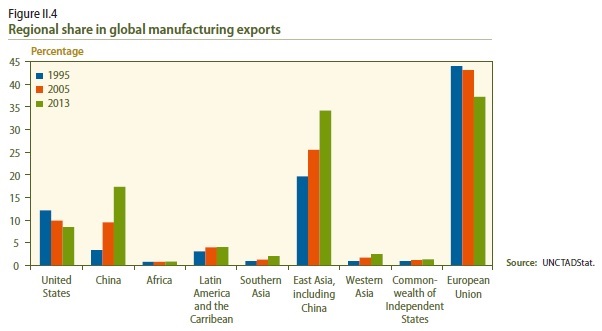
Much of the rise in developing countries’ share of world exports is due to East Asia’s rapidly increasing share of global manufacturing exports, which has risen from one fifth in 1995 to over one third in 2013. The expansion of China’s world trade profile has been a significant driving force in this rise, with a more than fivefold increase in the country’s share of global manufacturing exports, to about 17.3 per cent in 2013. A significant portion of the shift in manufactured goods trade shares has come at the expense of the United States, whose share fell by almost 4 percentage points. The EU is still the leading global manufacturing exporter, but its share also decreased, from 44.0 per cent in 1995 to 37.2 in 2013. If current trends persist, East Asia will take over as the largest exporter of manufactures by value in the forecast period.
Within the manufacturing sector there have been some significant changes, particularly as global value chains have expanded across the globe. Along with its overall increase in manufacturing exports, East Asia has seen its share of electronics exports rise from less than 20 per cent in 1995 to about 50 per cent in 2013. Mirroring this upward trend in East Asia, major developed-country electronics exporters, such as Japan, the United States and some European countries, have seen their shares diminish. There have been two parallel developments in this process. Some East Asian economies such as the Republic of Korea and Taiwan Province of China have seen their exports of intermediate goods to other countries (mainly in the region) rise, along with increases in the intermediate goods embedded in their own exports. China, on the other hand, continues to rely to a much greater degree on imported inputs for its exports with limited input into other country’s production processes. Meanwhile, the Philippines has seen its exports increasingly contribute to value chains in other countries, while absorbing a decreasing fraction of inputs from other countries in their own exports.
Trends for exports of primary products are somewhat different, influenced to some degree by changes in commodity prices over the past years. Overall, there has been a significant decline in the EU share in primary product exports, from 32 per cent in 1995 to about 22 per cent in 2013. This decline has been seen across almost all types of commodities, with only a few exceptions, such as tobacco, some types of crude materials, and animal oils and fats. In particular, there have been noticeable declines in the EU export shares in products such as meat, sugar, dairy products, beverages and crude fertilizers. However, the region continues to provide a significant portion of the world’s exports in many of those areas. At the same time, some regions have increased their market shares of primary commodities, with the biggest increase coming from Western Asia – although this was only by a little more than 8 per cent over the same period, particularly in fuels. For fuels in particular, the CIS has seen an increase from 1995 to 2013 by 4.5 percentage points to almost 15 per cent of world fuel exports. The United States has seen a relatively large increase in its share of fuel exports as well, by 55 per cent between 1995 and 2013. This increase still only puts United States’ fuel exports slightly above 4 per cent of the world total, but this is high enough to rank in the top five world fuel exporters.
Trade in services
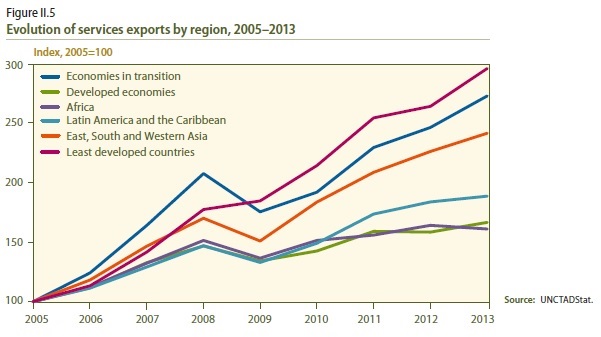
World services exports have continued to increase in recent years, providing some support to the sluggish performance of global trade. According to the most recent data, global exports of services increased by 5.5 per cent in 2013 and 7.0 per cent in the first quarter of 2014, at current prices. As a result, services exports reached $4.7 trillion in nominal value in 2013, about 20 per cent of total exports. The upward trend in services exports has been driven by developing countries, particularly in Asia and Latin America, as well as economies in transition. In addition, least developed countries (LDCs) have exhibited a remarkably fast expansion, although starting from a low initial level. As a result, between 2000 and 2013, the share of developing countries in world services exports rose from 23 per cent to 30 per cent, particularly in construction and computer and information services.
Trade in services is highly correlated with foreign direct investment (FDI). Over 70 per cent of world FDI outflows between 2010 and 2012 were related to services activities. Developing countries’ share in global FDI outflows into services is still low at 17.0 per cent, but this represents a remarkable increase from the early 1990s when it was only 0.6 per cent. Services trade also requires cross-border movement of people supplying services in export markets, particularly the provision of professional and business services, and thus has a strong linkage to the growth in global remittance flows.
Between 2008 and 2013, the most dynamic services trade sectors in developing countries were computer and information services, posting an annual average growth in exports of these services by 13.0 per cent. Other fast-growing services trade sectors for developing countries were insurance services, followed by travel services and financial services. Communication services, however, have not yet recovered their pre-crisis level. Meanwhile, LDCs posted the highest increase in computer and information services, insurance services and, in particular, construction. However, these sectors together represented just 7.0 per cent of total services exports for LDCs in 2013.
WESP is produced at the beginning of each year by the UN Department of Economic and Social Affairs (UN/DESA), the UN Conference on Trade and Development (UNCTAD), the five UN regional commissions and the World Tourism Organisation (UNWTO).


