News
World Bank publishes 2016 edition of International Debt Statistics

The 2016 edition of International Debt Statistics was published on 16 December 2015, and provides comprehensive data on the debt of low- and middle-income countries, and quarterly external and public sector debt statistics for high income economies.
The International Debt Statistics 2016 provides users with comprehensive stock and flow data on the external debt of individual low- and middle-income countries and for regional and analytical groupings and data on aggregate net capital flows (debt and equity) in 2014. In addition, International Debt Statistics (IDS) showcases other debt data collected and compiled by the World Bank. These include the high-frequency, quarterly data for high-income and low- and middle-income countries reported to the joint World Bank-International Monetary Fund (IMF) Quarterly External Debt Statistics (QEDS) and to the Public Sector Debt (PSD).
The main messages from the 2014 data are:
-
Net debt flows to low- and middle-income countries were $464 billion in 2014, a decrease of 18 percent from the comparable figure for 2013. The decline was driven down by a precipitous fall in net short-term debt flows that fell 60 percent to $72 billion ($188 billion in 2013).
-
Net equity inflows, $668 billion, were 7 percent higher than the 2013 level propelled by a 4 percent increase in net foreign direct investment and robust portfolio equity flows, which were up 29 percent. Aggregate net financial flows totaled $1,132 billion, 5 percent lower than 2013, but stable when measured relative to low- and middle-income countries’ gross national income (GNI) at 5 percent.
-
External debt burdens in low- and middle-income countries remained moderate. The ratio of external debt to GNI averaged 22 percent in 2014, and the ratio of external debt to exports averaged 79 percent. International reserves stood at 114 percent of external debt stocks.
-
Countries reporting to the QEDS and PSD confirm that external debt levels in high-income countries are, on average, much higher than those of low- and middle-income countries, but that government debt-to-GDP ratios moderated in 2014.
Highlights: Sub-Saharan Africa
Net debt inflows offset the decline in net equity flows
Net financial flows to Sub-Saharan Africa rose 10 percent in 2014, to $78 billion, with a 20 percent drop in net equity flows, more than offset by a 48 percent rise in net debt flows. The decline in net equity flows was driven in large measure by the $3.9 billion outflow of foreign direct investment from Angola and much lower net inflows of portfolio equity to Nigeria. Net debt inflows rose to $47 billion ($31 billion in 2013) of which 64 percent were accounted for by private creditors. Around 26 percent of net debt flows to the region went to South Africa: its share of comparable debt flows in 2013 was 11 percent. Net financial inflows to the region, excluding South Africa, fell 3 percent in 2014 with a 23 percent rise in net debt inflows, to $34 billion ($28 billion in 2013), not enough to offset the 23 percent drop in net equity flows.
Long-term debt inflows rise 34 percent with private creditors dominant
External borrowing by countries in the region, excluding South Africa, has risen rapidly and been marked by a distinct change in borrowing patterns and creditor composition. Disbursements of long-term debt increased 34 percent in 2014 (to $54 billion), triple the comparable figures for other low- and middle-income countries, with private creditors accounting for 60 percent (50 percent in 2013). Disbursements from private creditors have also become more diversified. In 2010, all long-term private debt was attributable to banks and other private creditors, whereas in 2014, 27 percent was accounted for by bond issuance. Borrowing patterns have also changed with disbursements from private creditors now going primarily to nonguaranteed private-sector borrowers. Disbursements from official creditors (excluding the IMF) rose 30 percent between 2010 and 2013. The momentum continued in 2014 when they rose a further 8 percent to $21.5 billion. This increase was largely attributable to a 14 percent rise in disbursements by multilateral creditors, notably those from the World Bank. Disbursements from IDA, $5 billion in 2014, were unchanged from their 2013 level, but IDA remained by far the single largest multilateral creditor. China was again the continent’s most important bilateral creditor.
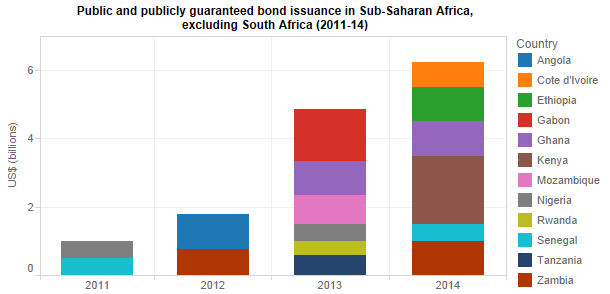
Bond issuance booms
Historically, bond issuance in Sub-Saharan Africa was confined to South Africa, but following Ghana’s debut issue in 2007, sovereign bond issuance by countries in the region, including those that benefited from HIPC and MDRI debt relief, has been a rapidly rising phenomenon. Benign global market conditions and the investor desire for higher returns have facilitated access to international capital markets. Sovereign borrowers, excluding South Africa, issued $6 billion in 2014, equivalent to 29 percent of disbursements from official creditors and 25 percent of foreign direct investment inflows. The debut sovereign bonds issued by Ethiopia ($1 billion) and Kenya ($2 billion) were massively over-subscribed, and the same applied for countries returning to the market, such as Ghana and Zambia. Proceeds of sovereign bonds are used to benchmark for future government and corporate bond markets issues, to manage the public debt portfolio, and for infrastructure financing. In Ethiopia, the 10-year, 6.625 percent Eurobond issued in December, 2014, is earmarked for development of sugarcane plantations, a hydropower dam, and amelioration and extension of the railway network.
International Debt Statistics 2016 and detailed debt statistics can be viewed, visualized, and downloaded here: http://datatopics.worldbank.org/debt/ids.


