News
Illicit financial flows are significant and persistent drag on developing country economies

Trade misinvoicing undermines the impact of international trade in developing nations
A new analysis of illicit financial flows (IFFs) due to trade misinvoicing in 148 developing countries demonstrates that trade-related IFFs appear to be both significant and persistent features of developing country trade with advanced economies. As such, trade misinvoicing remains an obstacle to achieving sustainable and equitable growth in the developing world.
This update, titled Illicit Financial Flows to and from 148 Developing Countries: 2006-2015, is the latest in a series of Global Financial Integrity (GFI) reports which provide country-level estimates of the illicit flows of money into and out of 148 developing and emerging market nations as a result of their trade in goods with advanced economies.
IFFs are defined as money that is illegally earned, used or moved and which crosses an international border. Trade misinvoicing is a method of moving IFFs, and includes the deliberate misrepresentation of the value of imports or exports in order to evade customs duties and VAT taxes, launder the proceeds of criminal activity or to hide offshore the proceeds of legitimate trade transactions, among other motivations.
Increasing trade among developing and emerging market countries is seen by many economists as a primary path to greater development. However, high levels of misinvoicing, as a percentage of total trade, indicate that most developing country governments do not benefit from a significant portion of their international trade transactions with advanced economies. Highlights of GFI’s research for 2015 (the most recent year for which there is usable data) show that:
-
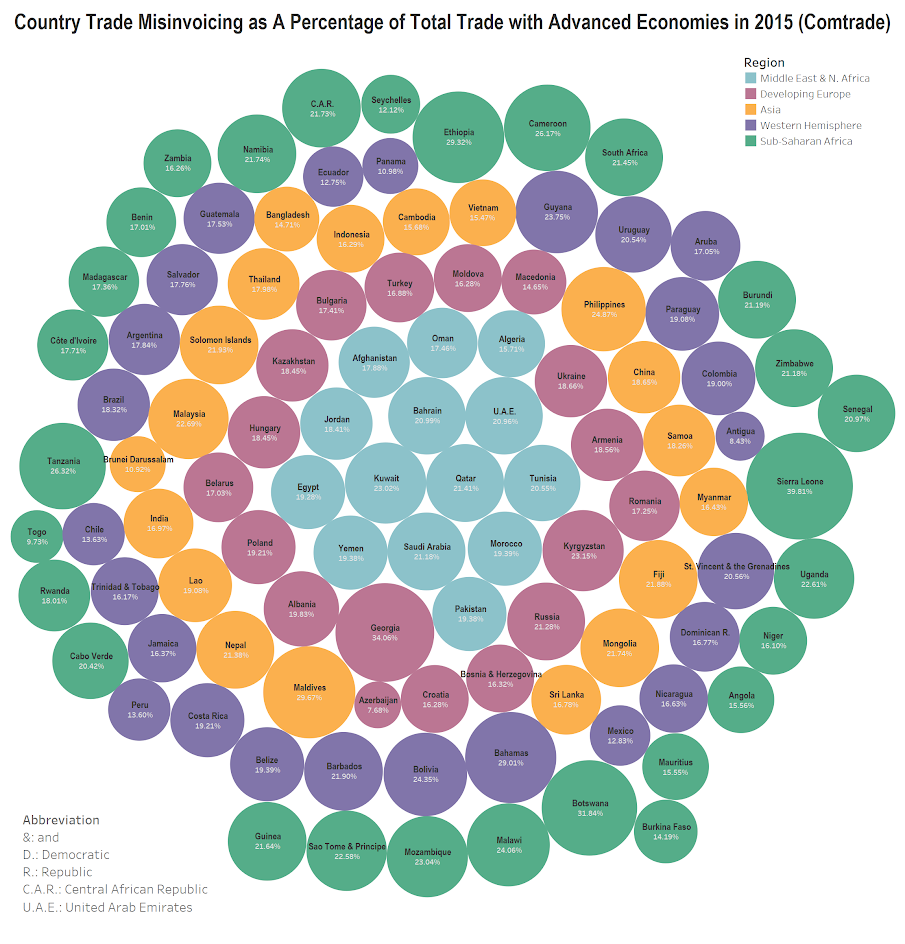
On average, trade misinvoicing is equivalent to 18 percent of total trade with advanced economies among all developing countries.
-
Several nations have trade misinvoicing levels significantly higher than the global average including: Sierra Leone (39.8%), Georgia (34%), Botswana (31.8%), Maldives (29.6%), Ethiopia (29.3%), The Bahamas (29%) and Cameroon (26%).
-
On average, illicit inflows (53% of total) are greater than illicit outflows.
-
Countries with high dollar values of illicit inflows include: Indonesia ($10.1 billion), Romania ($6.8 billion), Chile ($3.2 billion), Colombia ($2.9 billion), Morocco ($2.7 billion) and Tunisia ($2.3 billion)
-
Nations with high dollar amounts of illicit outflows include: Mexico ($31.5 billion), Malaysia ($22.9 billion), Brazil ($12 billion), Vietnam ($9.1 billion), Hungary ($7.6 billion), South Africa ($5.9 billion), Algeria ($4.1 billion), Bangladesh ($2.7 billion) and Tunisia ($1.8 billion).
-
A different set of countries is produced when ranked by illicit outflows as a percentage of total trade with advanced economies, including Uganda (14.7%), Rwanda (13.7%), and Namibia (13.6%), as well as Costa Rica (12.5%), Colombia (12.1%) and Guatemala (11.9%).
In addition to updating the estimated IFFs GFI has presented in the past, this report widens the scope of its research and uses a more detailed database published by United Nations (UN) Comtrade along with updated measures from the International Monetary Fund (IMF) data it has used previously. This report presents estimates of IFFs based on both data sets.
While the Comtrade data set is more detailed, not all countries provide their trade data to the UN and therefore are not represented in this analysis. Many of the 44 nations that do not report trade transactions to the UN are small states, however a few non-reporting countries have substantial economies including Kenya, Nigeria and Venezuela. Trade-related illicit flows for these nations (and the other 41 countries not reporting to the UN) can be found in the report using the IMF’s Direction of Trade Statistics (DOTS) data set (see Appendix Table III-1).
Highlights of GFI research for the year 2015 using the DOTS dataset from the IMF shows that:
-
The top quintile (30) of countries, ranked by dollar value of illicit outflows, includes resource rich countries such as South Africa ($10.2 billion) and Nigeria ($8.3) but also European countries including Turkey ($8.4 billion), Hungary ($6.5 billion) and Poland ($3.1 billion) as well as Latin American nations Mexico ($42.9 billion), Brazil ($12.2 billion), Colombia ($7.4 billion) and Chile ($4.1 billion). Asian states in the top 30 countries of this category include Malaysia ($33.7 billion), India ($9.8 billion), Bangladesh ($5.9 billion) and the Philippines ($5.1 billion).
-
The top quintile (30) of countries, ranked by illicit outflows as a percentage of total trade with advanced economies, produces an entirely different group of countries including Mozambique (48.1%), Malawi (44.1%), Zambia (43%), Honduras (39.7%), Namibia (38.7%) and Myanmar (30.8%).
-
The list of top 30 countries ranked by dollar value of illicit inflows[1] include a regionally diverse group including Vietnam ($22.5 billion), Thailand ($20.9 billion), and Indonesia ($15.4 billion) as well as Latin American nations Panama ($18.3 billion) and Argentina ($4.8 billion). Additional countries include Kazakhstan ($16.5 billion), Belarus ($6.1 billion) and Morocco ($3.9 billion).
[1] Note: illicit inflows are a type of resource curse in that a) their origin is unknown, b) inflows are invisible to governments, c) they are not taxed, and d) they often times fuel illegal activities such as drug trafficking.


