
Blog
Understanding Africa’s Place in Regionalised Global Trade

Since the era of the internet began, globalisation has gathered pace and the countries of the world have become more economically integrated. The significant improvements in communications brought about by technological deepening and the internet have brought countries closer together and lead to the development of global value chains and intra-industry trade. Globalisation has created trade patterns that truly span the length of the globe – from Argentina to South Africa, Russia to New Zealand – container transport and air freight have shortened distances and made general importables out of what were once exotic goods.
Interestingly, the predominant trade flows in the world today are between the US and China, which spans literally from East to West. This trade flow and the other parts of the global trade pattern have developed as countries have developed sector specialisations and resultant comparative trade advantage. The US is the world leader in technology services exports; China the world leader in manufactured goods exports. These trade flows complement each other and constitute the basis of reciprocal, mutually-beneficial trade.
There are other examples of substantial trade flows spanning the globe – those between Japan and the US and Japan and the EU. The latter grouping engage in one of the most interesting examples of intra-industry trade. European consumers buy Japanese cars and Japanese consumers buy European cars – primarily luxury German vehicles. However, while global flows exist and are important, regional flows are equally important and are usually the result of the existence of regional economic communities.
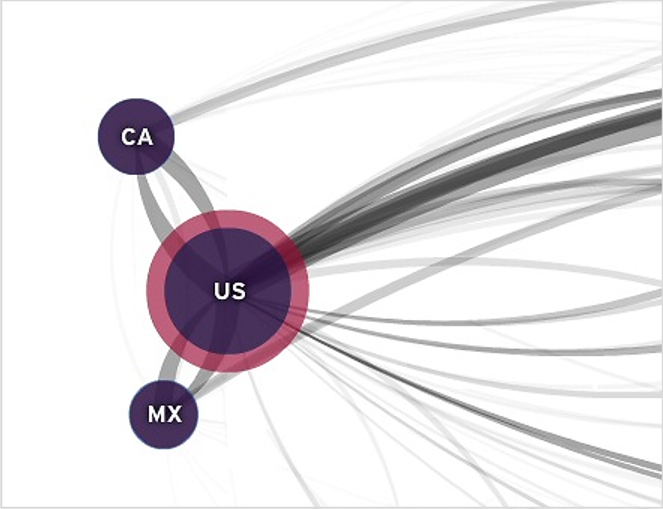
Moving from west to east, it is clear that NAFTA is the leading trade bloc in the world, when it comes to the volume of trade flows per country. The figure below (Figure 1) is a visualisation of these trade flows, with the size of the bubble reflecting the volume of trade, a red border around the US node shows that it is a net merchandise importer (a blue would indicate the opposite).
The figure shows the extent of the insularity of NAFTA – primarily with respect to the roles of Canada and Mexico. These nations trade primarily with the US, which trades more extensively with the rest of the world – primarily the EU and the far east (China and Japan). The NAFTA pattern is additionally striking in that the two ‘satellites’ of the US do very little trade with each other but both trade bidirectionally with the US.
Figure 1: Trade Flows in and from NAFTA (Citi)
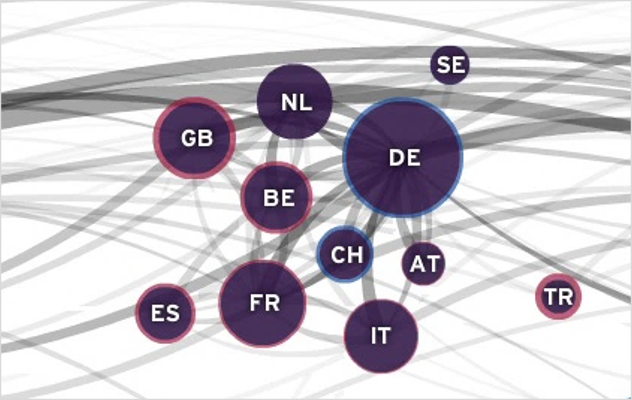
The insularity of NAFTA seems to be an extreme among the large economies of the world. Moving to the EU (Figure 2, includes Switzerland), there is certainly a high level of intra trade within the bloc, but the intensity of intra-trade is not quite at the level of NAFTA. Three economies stand out as being more ‘global’ than the others – the UK, Netherlands and Germany, with the balance of the countries clearly trading more within the EU than outside.
Figure 2: Trade Flows in and from the EU (Citi)
The fact remains however, that the EU is the most import global trade bloc from the perspective of the intensity of integration – it is a single market – and the number of member countries and their level of development. When one moves east, there is no equivalent to either of the two dominant western trade blocs, although ASEAN is on track to greater levels of integration of its members.
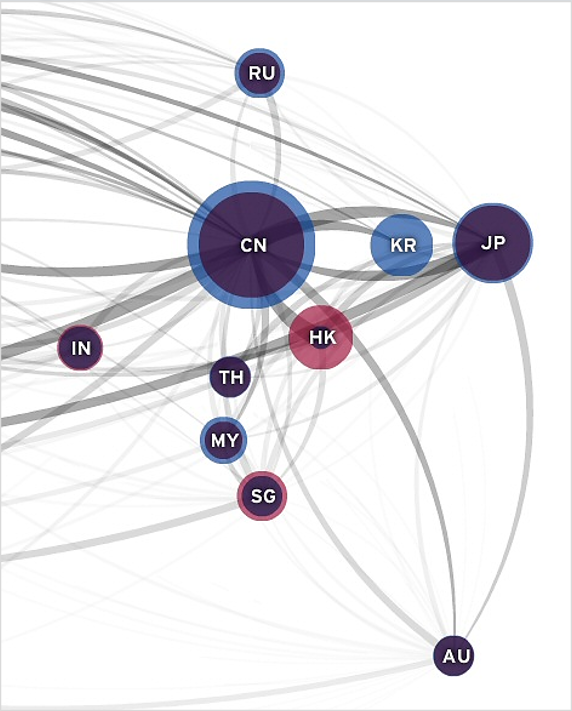
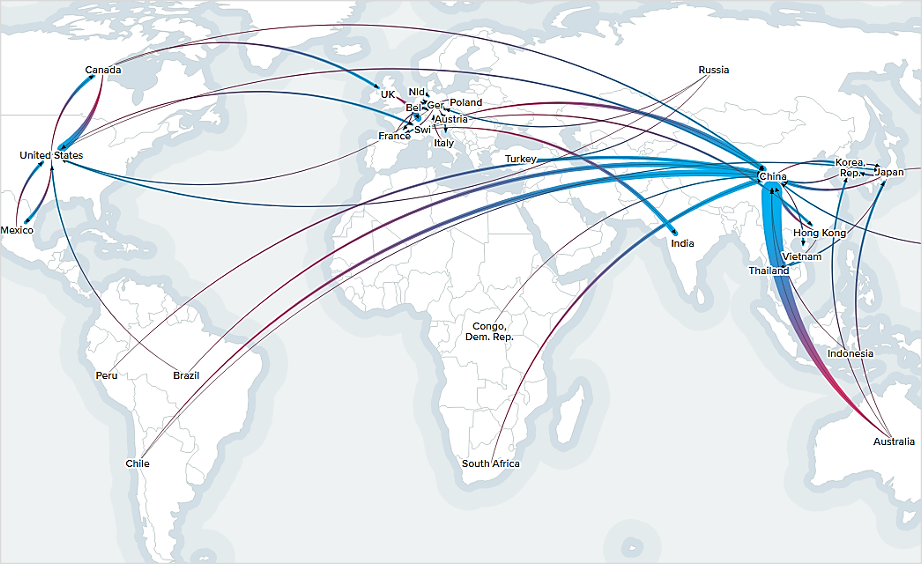
Figure 3 presents the visualisation of Russia, the Far East and Australasia, showing that external trade flows are as important or more so than trade flows within the region. This reflects the fact that there is no single trade bloc that includes these countries, unlike the previous two examples. ASEAN includes some of these nations and several of them are part of the TPP – which from its membership (some Asian as well as South and North American countries) – perhaps confirms the ‘outward looking’ nature of this group.
Figure 3: Trade Flows in and from Russia, the Far East and Australasia (Citi)
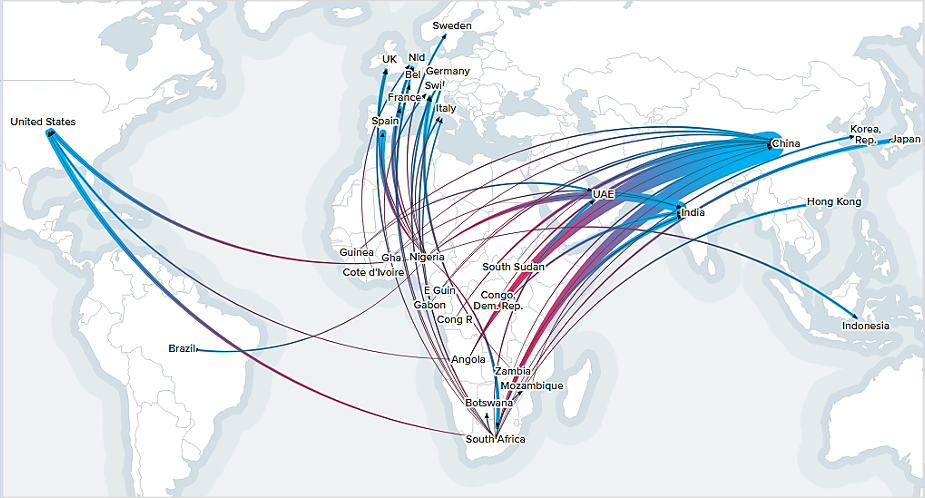
Turning to Africa, it is a commodity exporting specialist to the Far East, Europe the Americas, in that order. Africa exports fuels, minerals & metals, gemstones, agricultural goods and forestry goods to these nations, in that order. There are multiple regional economic communities (RECs) among the nations of Africa, yet the bulk of African trade is not within Africa but it is external.
Figure 4 depicts these export flows. The breadth of the line at its termination (the blue end) indicates the volume of the flow[1]. The figure shows the top 14 sub-Saharan African (SSA) countries by total value of trade. Although countries such as Kenya are important agricultural and agro-processed exporters in SSA, they fall below the threshold by value of total exports and so are not shown. On the other hand, minerals exporters such South Africa and the DRC are shown, as well as fuels exporters such as Nigeria and Angola.
African exporters enjoy preferential access to the US (under AGOA) and to the EU (under the EPAs, although they do not currently cover all of Africa). Nevertheless, the greatest value of commodities exports are to the Far East, where no preferential access is enjoyed. However it should be noted that primary goods rarely face significant trade barriers when imported into developed countries. The one exception would be the SPS faced by agricultural exports.
Figure 4: Africa's commodity exports to the world (Chatham House)
In order to contextualise Africa’s significance in world commodity trade, the same figure as above can be redrawn with all the world’s most important commodities exporters included (not shown). In this group of approximately 40 countries, only three African countries make the cut – Nigeria, Angola and South Africa – and they are at the bottom of the list.
If one redraws the figure for the metals and minerals sub-group, at time of writing the largest African commodity export sub group by value, the situation does not change much (Figure 5). In the group of the top approximately 30 exporters, only two African countries – South Africa and the DRC – make the cut. Similar patterns are evident when the commodity category is changed to fuels products, agricultural products or forestry products.
Figure 5: Global trade in metals & minerals (Chatham House)
These visualisations help to contextualise Africa’s place in world trade, and specifically world commodities trade, which Africa specialises in. African exporters have access to the two primary trade blocs in the West – the EU and NAFTA – and have built up new trade relationships with emerging industrial nations such as China and India. Nevertheless, by volume of trade African countries are at present not significant players. Of even less significance are intra-African trade flows, in stark contrast to the high levels of intra trade and interdependence in NAFTA and the EU. This underscores the importance of the nascent African Continental Free Trade Area (AfCFTA). The trade patterns that exist now are still reminiscent of those established during colonial times – a flow of primary goods to the developed world and a return of finished goods. The AfCFTA can help to progress Africa away from these patterns, where more of Africa’s considerable resources are traded within the continent and are used for beneficiation into more finished and value-added products.
[1] Commodities trade visualisations sourced from https://resourcetrade.earth/
About the Author(s)
Leave a comment
The Trade Law Centre (tralac) encourages relevant, topic-related discussion and intelligent debate. By posting comments on our website, you’ll be contributing to ongoing conversations about important trade-related issues for African countries. Before submitting your comment, please take note of our comments policy.
Read more...


