Discussions
Reflections on the recent World Bank ‘Doing Business 2014: Southern African Development Community (SADC)’ report
Gavin van der Nest, tralac Researcher, discusses the key findings of the World Bank’s Doing Business 2014 regional report on SADC
The World Bank ‘Doing Business 2014: Southern African Development Community (SADC)’ report was published on the 5th June 2014. This report specifically deals with the obstacles small businesses face when attempting to open and run a small to medium-size business in the region when complying with relevant regulation. It considers 11 areas in the life cycle of a business; starting a business, dealing with construction permits, getting electricity, registering property, getting credit, protecting investors, paying taxes, trading across borders, enforcing contracts, resolving insolvency and employing workers.
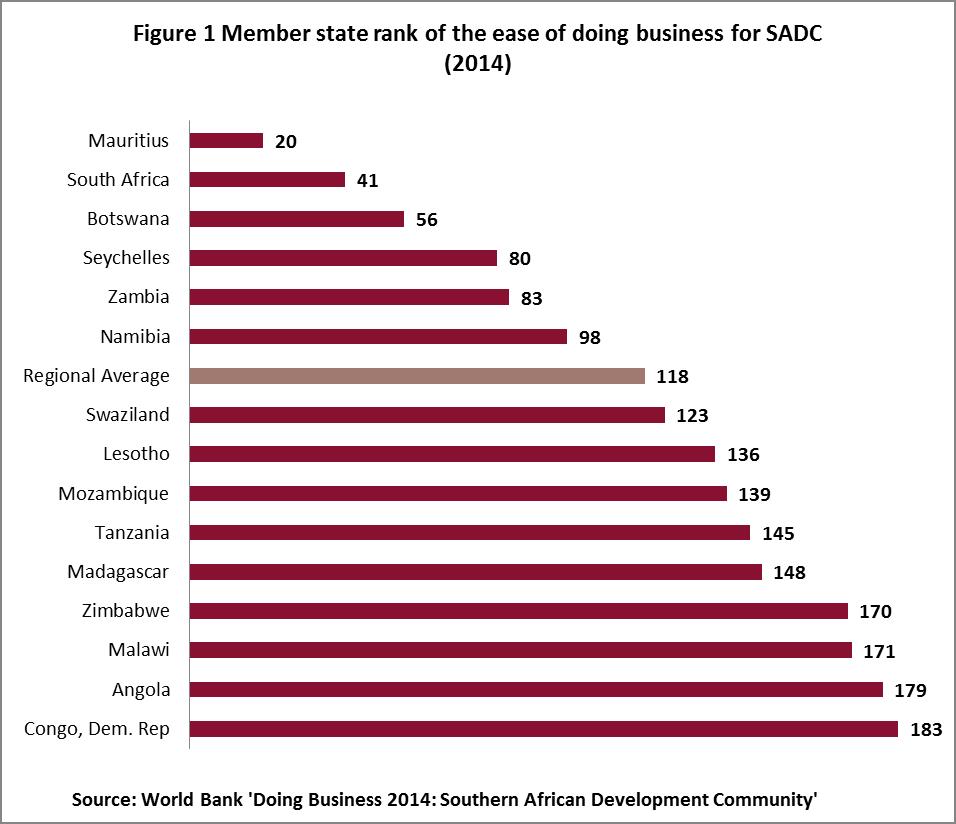
When considering Africa as a whole and taking a simple average of the percentile rankings of the 10 topics as detailed in the ‘Doing Business 2014’ report the top performing African countries (when ranked out of a total of 189 countries worldwide) include Mauritius (20), South Africa (41), Botswana (56) and Ghana (67). This generally shows that of the African governments considered not many have created a regulatory environment that fosters business operations. Figure 1 gives a snapshot of SADC member state rankings as computed in the report.

The regional average ranking of 118 corresponds to approximately 60% of the global countries considered ranking better than SADC as a whole in terms of ease of doing business. Most of the SADC member states fair quite poorly in the global rankings. Only Mauritius, South Africa, Botswana, the Seychelles and Zambia feature in the top 50th percentile of global rankings when the categories are considered as a whole.
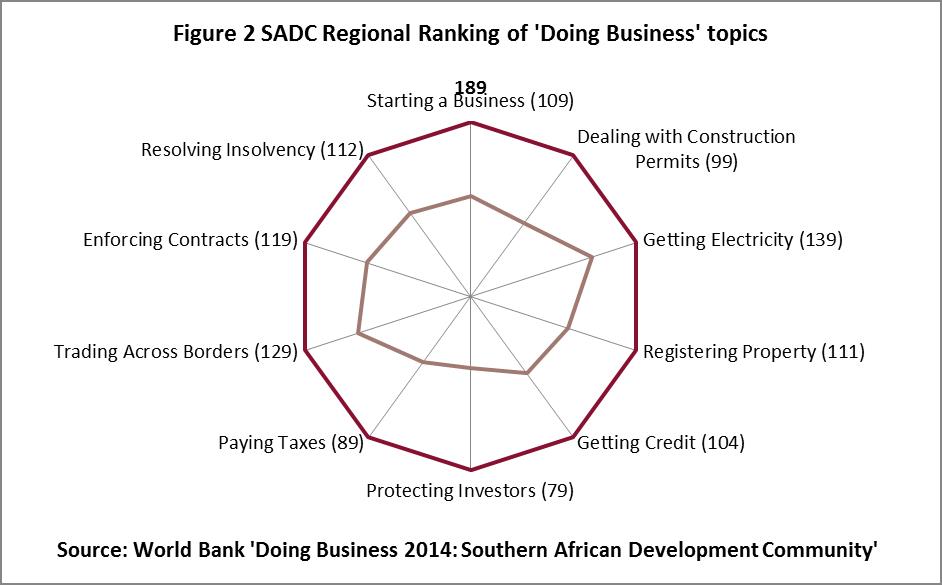
Figure 2 shows the regional averages for the ten indicators used in the report. The SADC region in general has performed quite poorly in these business indicators with access to electricity (rank 139) and trade across borders (rank 129) being of particular concern. Poor access to credit is also a hindrance to business creation and success in the region.

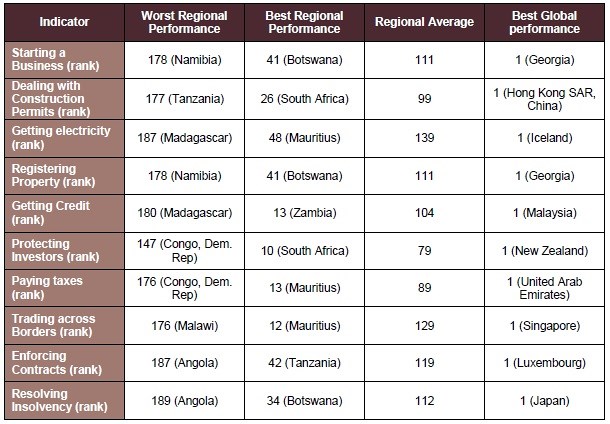
According to the Report the ten business topics are disaggregated into smaller constituent indicators and the interested reader is referred to the report for greater detail. A comparison of the best and worst regional performer against the best global performer is given in Table 1.
Table 1: ‘Doing Business’ indicator performance for SADC region

When examining the SADC region we see that it is easier to start a business, to register property as well as to resolve insolvency in Botswana. Mauritius has the best access to electricity, best performance in paying taxes as well as trading across borders. Angola is the worst in the world when trying to resolve insolvency as well as close to the bottom of the pile when enforcing contracts. Madagascar also features exceptionally poorly when considering access to electricity as well as to credit.
As the world economy becomes ever more globalised the facilitation of trade between economies is become increasingly important for business. Various non-tariff barriers (NTBs) such as excessive prohibitive document requirements, slow and inefficient port of entry operations, inadequate and often lack of infrastructure as well as burdensome customs processes all contribute to extra and often unwarranted costs and delays for importers and exporters which lead to a reduction in trade potential. It is interesting to note that, as pointed out in the report, a 10% drop in trading costs leads to greater gains for exporters in developing countries than from a similar reduction in tariffs applied to their products in global markets. It is for these reasons as well as its importance in regional integration that the ‘Trading Across Borders’ indicator will be more closely examined.
Table 2: Trading Across Borders

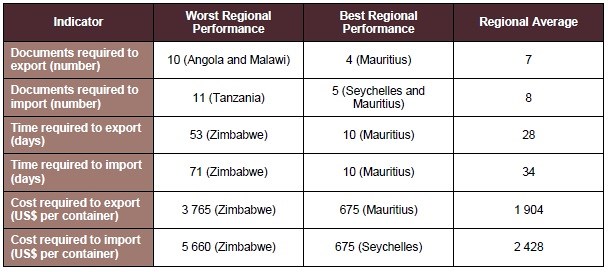
The average rank for the SADC region on the ‘Trading Across Borders’ indicator is 129 which is substantially worse than the EU (36) and MENA (89). However, SADC slightly outperforms the regional average of the ECOWAS (133) which points towards a slight advantage in its ability to facilitate the export and import of goods. Mauritius is the clear leader in SADC with a rank of 12 whilst the Seychelles comes in second at 29. The worst performer is Malawi with a rank of 176 and the regional powerhouse of South Africa is third on the list, but with a relatively poor rank of 106. Traded goods are assumed to be not hazardous and not military items, do not require refrigeration or any special environment and are not subject to special phytosanitary or environmental safety standards except those internationally accepted, are one of the economy’s leading export or import products and are transported in a dry-cargo, 20-foot full container load.
Documents required to export and import include; bank documents, customs clearance documents, port and terminal handling documents as well as transport documents.
The regional average for the number of documents required to export is 7 which is the same as ECOWAS and slightly more than MENA (6) and the EU (4). The best performer is Mauritius, where 4 documents are required, and is closely followed by South Africa, the Seychelles and Madagascar which require 5. Malawi and Angola are the worst performers which require 10 documents.
On average, 8 documents are required to import for the region. This is again significantly higher than the EU (5). SADC performs the same as MENA (8) and outperforms ECOWAS (9). Tanzania and Malawi are joint worst regional performers where it takes 11 documents to import with Mauritius and the Seychelles requiring the least at 5 documents each. South Africa requires 6 documents.
The time required to export and import, measured in days, includes the time taken in obtaining, filling and submitting the relevant documents as well as inland transport and handling, customs clearance and inspections as well as port and terminal handling.
The worst SADC export performer is Zimbabwe where it takes approximately 53 days to export a container of goods, whilst it takes only 10 days to do the same in the region’s star performer Mauritius. South Africa takes 16 days. The regional average is 28 days which is slightly longer than ECOWAS at 26 and significantly greater than MENA (20 days) and the EU (12 days).
For time taken to import a container, Zimbabwe is again the worst regional performer where it takes on average 71 days to import. Mauritius is again the star performer at 10 days and South Africa takes approximately 21 days. The SADC regional average is 34 days which is considerably higher than ECOWAS (31 days), MENA (24 days) and the EU (11 days).
When the report considers the cost required to export and import (US$ per container), this includes; all documentation, inland transport and handling, customs clearance and inspections, port and terminal handling and official costs only. Bribes are excluded.
When considering the cost of exporting, Zimbabwe has prohibitively high costs of approximately US$ 3 765 per container which is almost double the regional average of US$ 1 904 and significantly higher than the ECOWAS (US$ 1 598), MENA (US$ 1 127) and EU (US$ 1 024). SADC member states with the lowest export costs include Seychelles (US$ 705) and Mauritius (US$ 675). Exports costs for South Africa average US$ 1 705 per container.
Import costs per container in the region average US$ 2 428 which is considerably higher than the ECOWAS (US$ 2 111), MENA (US$ 1 360) and the EU (US$ 1 066). Zimbabwe has the most exorbitant costs of US$ 5 660 per container whilst the Seychelles and Mauritius again have the lowest costs of US$ 675 and US$ 710 respectively. South Africa averages US$ 1 980 per container.
To facilitate trade across borders governments around the world have introduced various tools. These have included single windows, risk-based inspections and electronic data interchange (EDI) systems. Within SADC, the following reforms have occurred during the period 2008-2014; implementation of EDI systems, improvement of port infrastructure, streamlining of document requirements, computerized risk management systems for inspections, cooperation between customs officials of different member states, involving the private sector in terminal handling processes to speed up and increase quality of service, electronic submission of custom documents and the implementation of a Pre-Arrival Declaration (PAD) system to name a few.
When considering the trading across borders indicator as a whole, one may be inclined to conclude that the region is slightly more geared towards the export of goods, but definite improvements can still be made to ensure greater trade facilitation. Improvements in import processing and a reduction of import costs are also important as this enhances the competitiveness of local production and facilitates capital formation which would support wealth creation and the reduction of unemployment.
Mauritius is the clear frontrunner when considering trade across borders; the challenges facing small, island economies make strong international trade ties and cheaper trade essential to grow its economic base. SADC as a region fares poorly when compared to the EU and MENA and comparatively better than ECOWAS and although remedial steps have been taken to address the poor performance of trading across borders a lot still needs to be done, particularly with respect to customs facilitation and the implementation of cross-border agreements.
As a case in point, entrepreneurial activities and the subsequent creation of small and medium enterprises (SMEs) may often be considered the lifeblood of an economy. SMEs provide employment and business opportunities for a large proportion of the population as well as being an important source of revenue for governments. According to a Forbes report, in the US alone over 50% of the working population is employed in a small business and these have provided over 65% of net new jobs since 1995.
A small business is often a relative term and in developing countries such as South Africa they are often entrepreneurial in nature and employ around 100 people. It is estimated that small businesses in South Africa contribute approximately 30% to GDP, 70-80 % in employment but surprisingly at most 4 % to export earnings (Source: SouthAfricaWeb).
The generally poor performance of export earnings for small businesses in South Africa can be attributed to several factors. South Africa is burdened with a low rate of economic growth, endemic and pervasive unemployment in addition to high inflation and tax rates. The lack of performance could also be attributed to poor levels of education, the absence of management and work skills, difficulty of access to working capital and low levels of investment in research and development. However, it is widely believed that small businesses growth and development hold the key to powering South Africa’s economy and the government has made this a focus of its efforts as evidenced by the newly created Ministry of Small Business Development. It would be interesting to see what the focus of this new Ministry will be and what the relevant plan of action would be in recognising that the development of this sector is critical to economic development and transformation.

